


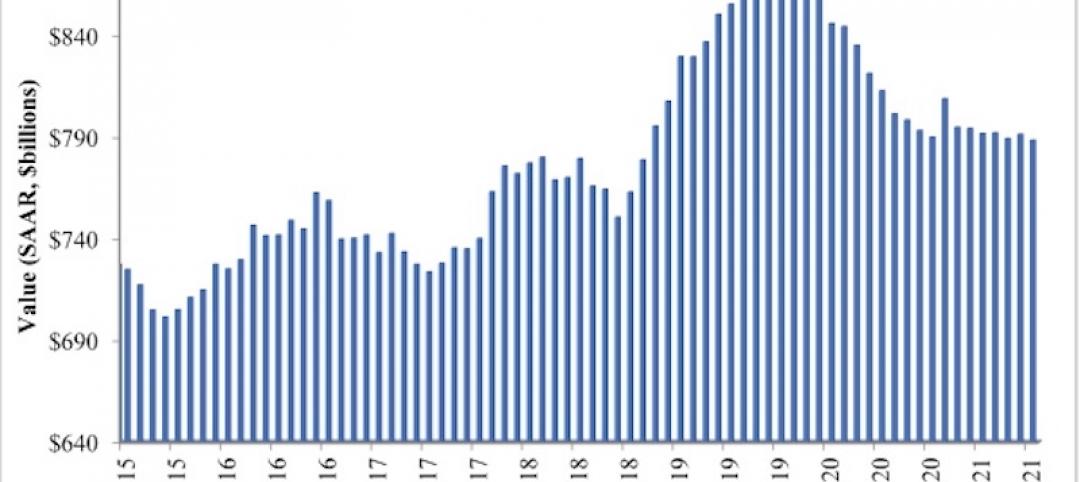
During the first half of 2018, five of the top ten metropolitan markets for commercial and multifamily construction starts ranked by dollar volume showed increased activity compared to a year ago, according to Dodge Data & Analytics. Of the top twenty markets, eleven were able to register gains. At the national level, the volume of commercial and multifamily construction starts during the first half of 2018 was $101.4 billion, down 1% from last year’s first half, although still 2% above what was reported during the first half of 2016.
The New York NY metropolitan area, at $16.1 billion during the first half of 2018, held onto its number one ranking and comprised 16% of the U.S. commercial and multifamily total, helped by a 44% jump compared to a year ago. During the previous two years, the New York NY share of the U.S. total had slipped to 14% in 2016 and 13% in 2017, after seeing its share reach a peak at 19% back in 2015. Other markets in the top ten showing growth during the first half of 2018 were Washington DC ($5.0 billion), up 23%; Miami FL ($4.9 billion), up 34%; Boston MA ($3.7 billion), up 56%; and Seattle WA ($3.2 billion), up 7%. Of these markets, the top four (New York, Washington DC, Miami, and Boston) showed renewed growth after the decreased activity reported for the full year 2017, while Seattle was able to maintain the upward track present last year. Metropolitan areas showing decreased activity for commercial and multifamily construction starts during the first half of 2018 were Dallas-Ft. Worth TX ($3.4 billion), down 23%; Los Angeles CA ($2.9 billion), down 38%; San Francisco CA ($2.8 billion), down 38%; Chicago IL ($2.7 billion), down 37%; and Atlanta GA ($2.0 billion), down 43%.
For those markets ranked 11 through 20, the six that registered first half 2018 gains were Austin TX ($1.8 billion), up 15%; Kansas City MO ($1.7 billion), up 52%; Orlando FL ($1.6 billion), up 4%; Phoenix AZ ($1.6 billion), up 19%; Minneapolis-St. Paul MN ($1.3 billion), up 34%; and Portland OR ($1.1 billion), up 15%. The four posting declines were Houston TX ($1.9 billion), down 13%; Philadelphia PA ($1.7 billion), down 13%; Denver CO ($1.6 billion), down 25%; and San Jose CA ($1.1 billion), down 37%.
The commercial and multifamily total is comprised of office buildings, stores, hotels, warehouses, commercial garages, and multifamily housing. At the U.S. level, the 1% drop for the commercial and multifamily total during the first half of 2018 reflected an 8% retreat for commercial building that was essentially balanced by an 8% increase for multifamily housing.

“Multifamily housing has proven to be surprisingly resilient so far during 2018, following its 8% decline in dollar terms at the U.S. level that was reported for the full year 2017,” stated Robert A. Murray, chief economist for Dodge Data & Analytics. “With apartment vacancy rates beginning to edge upward on a year-over-year basis, banks had been taking a more cautious stance towards lending for multifamily projects. Yet, after some loss of momentum during 2017, several factors appear to be providing near-term support for multifamily housing. The U.S. economy is currently moving at a healthy clip, with steady job growth bringing new workers into the labor force. The demand for multifamily housing by millennials remains
strong, given their desire to live in downtown areas while the increasing price of a single family home and diminished tax benefits may be dissuading some from making the transition to single family home ownership. As shown by this year’s surveys of bank lending officers conducted by the Federal Reserve, the extent of bank tightening for multifamily construction loans is not as widespread as a year ago.”
“On a broader level for commercial building, lending standards for nonresidential building loans have eased slightly over the past two quarters,” Murray continued. “And, the rollback of some of the Dodd-Frank restraints on the banking sector may encourage mid-size banks to increase lending for commercial real estate. While the expansion for commercial building and multifamily construction starts has clearly decelerated, the near-term shift appears to be one towards a plateau as opposed to a decline. This is consistent with the recent pattern for commercial and multifamily construction starts by major metropolitan areas, which reveals a fairly equal balance between those markets still showing gains and those markets showing decreased activity.”
Related Stories

Market Data | Oct 19, 2021
Demand for design services continues to increase
The Architecture Billings Index (ABI) score for September was 56.6.
Market Data | Oct 14, 2021
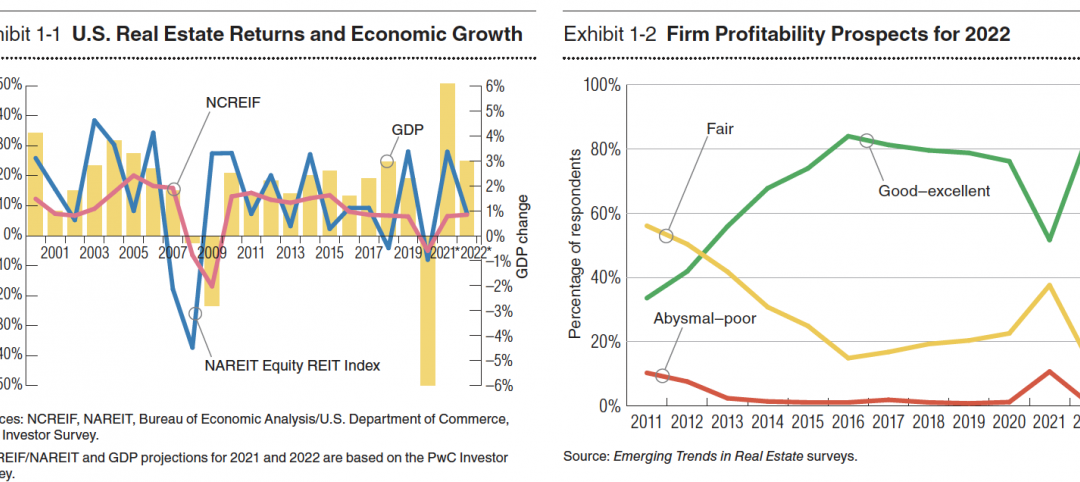
Climate-related risk could be a major headwind for real estate investment
A new trends report from PwC and ULI picks Nashville as the top metro for CRE prospects.
Market Data | Oct 14, 2021
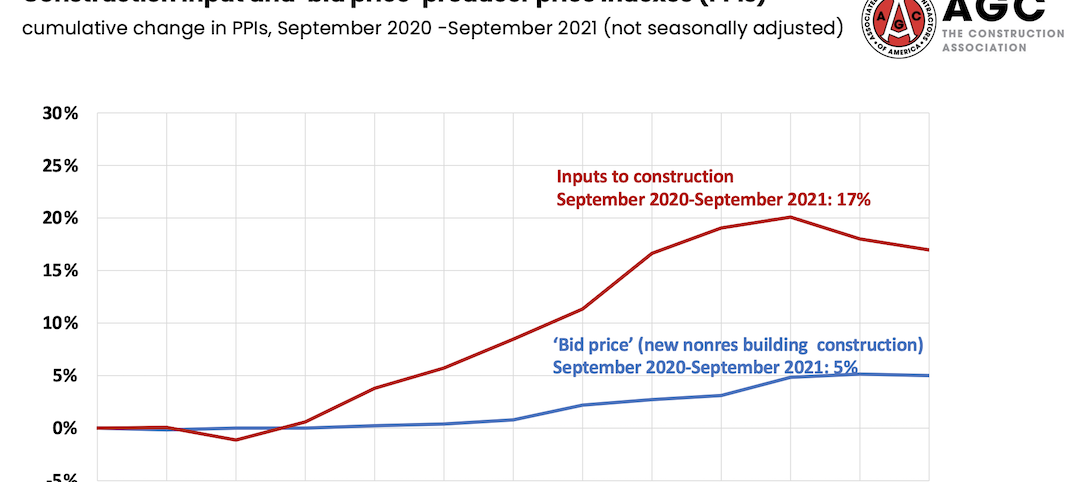
Prices for construction materials continue to outstrip bid prices over 12 months
Construction officials renew push for immediate removal of tariffs on key construction materials.
Market Data | Oct 11, 2021
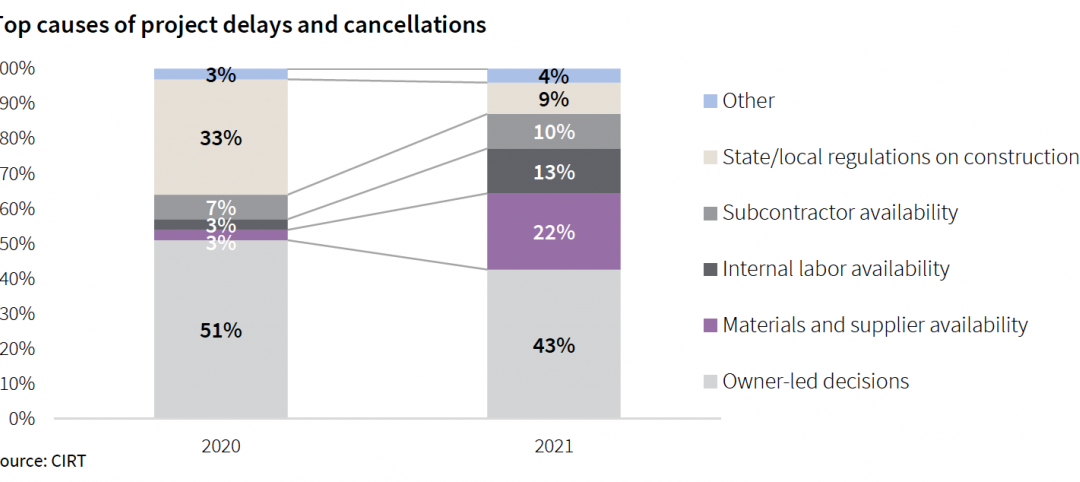
No decline in construction costs in sight
Construction cost gains are occurring at a time when nonresidential construction spending was down by 9.5 percent for the 12 months through July 2021.
Market Data | Oct 11, 2021
Nonresidential construction sector posts first job gain since March
Has yet to hit pre-pandemic levels amid supply chain disruptions and delays.
Market Data | Oct 4, 2021
Construction spending stalls between July and August
A decrease in nonresidential projects negates ongoing growth in residential work.
Market Data | Oct 1, 2021
Nonresidential construction spending dips in August
Spending declined on a monthly basis in 10 of the 16 nonresidential subcategories.
Market Data | Sep 29, 2021
One-third of metro areas lost construction jobs between August 2020 and 2021
Lawrence-Methuen Town-Salem, Mass. and San Diego-Carlsbad, Calif. top lists of metros with year-over-year employment increases.
Market Data | Sep 28, 2021
Design-Build projects should continue to take bigger shares of construction spending pie over next five years
FMI’s new study finds collaboration and creativity are major reasons why owners and AEC firms prefer this delivery method.
Market Data | Sep 22, 2021
Architecture billings continue to increase
The ABI score for August was 55.6, up from July’s score of 54.6.


