

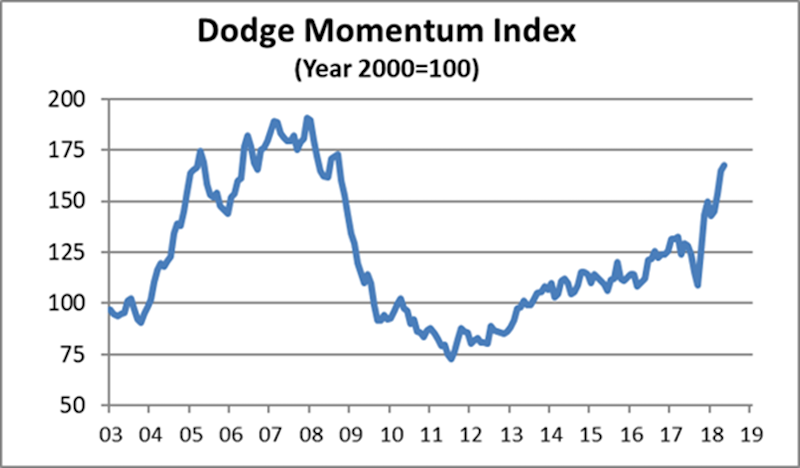
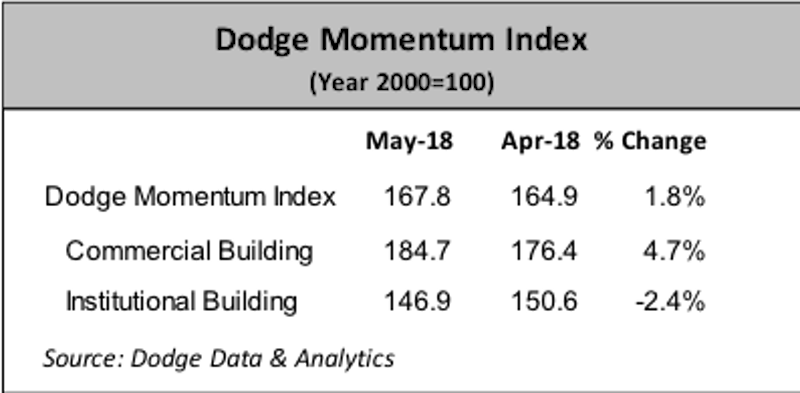
The Dodge Momentum Index eked out a small gain in May, moving 1.8% higher to 167.8 (2000=100) from the revised April reading of 164.9. The Momentum Index is a monthly measure of the first (or initial) report for nonresidential building projects in planning, which have been shown to lead construction spending for nonresidential buildings by a full year. May’s gain was the result of a 4.7% increase by the commercial component of the Momentum Index, while the institutional component fell 2.4%. The Momentum Index has posted solid gains through the first five months of 2018, rising 19% from the same period of 2017 and reaching a level not seen since mid-2008. However, the upturn to this point shows that the current expansion has been more drawn out than what occurred during the previous cyclical expansion. It has been nearly seven years since the Momentum Index hit bottom in July 2011, but it has yet to eclipse its previous peak set in December 2007. At the same time, the recent gains for the Momentum Index suggest that construction spending for nonresidential buildings should remain healthy through the rest of 2018.
In May, 16 projects each with a value of $100 million or more entered planning. The two leading commercial projects were a $310 million mixed-use complex in Newark NJ and the $300 million second phase of Nvidia’s headquarters in Santa Clara CA. The leading institutional projects were the $300 million Milwaukee County safety building in Milwaukee WI and the $300 million Texas Health Harris Methodist Hospital expansion in Fort Worth TX.

Related Stories

Data Centers | Jan 28, 2016
Top 10 markets for data center construction
JLL’s latest outlook foresees a maturation in certain metros.

Market Data | Jan 20, 2016
Nonresidential building starts sag in 2015
CDM Research finds only a few positive signs among the leading sectors.
Market Data | Jan 20, 2016
Architecture Billings Index ends year on positive note
While volatility persists, architecture firms reported healthy performance for 2015.

Market Data | Jan 15, 2016
ABC: Construction material prices continue free fall in December
In December, construction material prices fell for the sixth consecutive month. Prices have declined 7.2% since peaking in August 2014.

Market Data | Jan 13, 2016
Morgan Stanley bucks gloom and doom, thinks U.S. economy has legs through 2020
Strong job growth and dwindling consumer debt give rise to hope.

Hotel Facilities | Jan 13, 2016
Hotel construction should remain strong through 2017
More than 100,000 rooms could be delivered this year alone.

Market Data | Jan 6, 2016
Census Bureau revises 10 years’ worth of construction spending figures
The largest revisions came in the last two years and were largely upward.

Market Data | Jan 5, 2016
Majority of AEC firms saw growth in 2015, remain optimistic for 2016: BD+C survey
By all indications, 2015 was another solid year for U.S. architecture, engineering, and construction firms.

Market Data | Jan 5, 2016
Nonresidential construction spending falters in November
Only 4 of 16 subsectors showed gains

Market Data | Dec 15, 2015
AIA: Architecture Billings Index hits another bump
Business conditions show continued strength in South and West regions.


