

National construction of medical office buildings (MOBs) stood at 12.5 million sf in the first quarter of 2017, down slightly from a few years ago but still well above recession-era levels. However, construction continues to be outpaced by net absorptions, which between 2015 and Q1 2017 totaled 35.4 million sf, or 38% higher than completions over that same period.
In its first-ever report on U.S. Medical Office Buildings, CBRE notes that the vacancy rate for MOBs has “tightened steadily” since 2010, to its current level of 8%, a record low for this sector and well below the 13% vacancy rate for the U.S. office market.
To assess what’s driving MOB demand and development, CBRE took looked at Class A and B buildings with at least 10,000 sf of rentable area specifically designated as medical office space in 30 metros, with detailed investment and demographic profiles of each city.
It found a “resilient” MOB market that continues to benefit from several factors, not the least of which being the population growth of senior citizens. The U.S. Census Bureau estimates that the 65-plus population will nearly double between 2015 and 2055 to more than 92 million, and comprise nearly 23% of the country’s total population.
“The steep increase in both the 65+ population and anticipated greater need for in-office physician services by this group signal a continued increase in demand for health care services and medical office space in the decades ahead,” CBRE states.
Markets where the 65+ population is expected to grow strongest over the next five years include Las Vegas, Phoenix, Atlanta, Dallas-Fort Worth, Houston, and South Florida, according to Moody’s Analytics.
CBRE observes that providers are attempting to stem perennially increasing healthcare expenditures by moving more patient volume away from hospitals and toward more cost-effective outpatient facilities, such as MOBs and urgent-care centers.
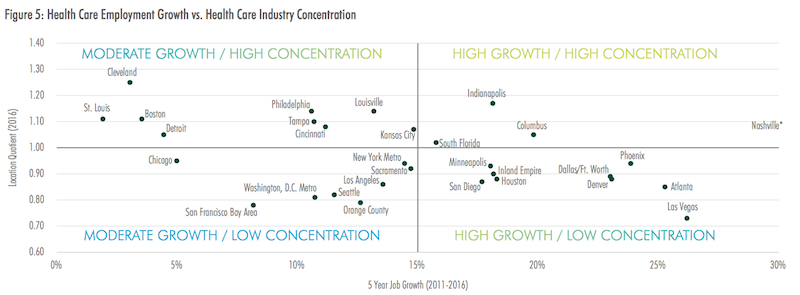
Health care jobs, particularly physicians, have been added at a much faster pace than jobs overall. Image: CBRE
Another cost-cutting trend that’s impacting healthcare real estate, says CBRE, has been the “significant uptick” in mergers and acquisitions. Consolidation among physician medical groups has been particularly strong, with deal volume surging by 19% in 2016 and 109% year-over-year in Q1 2017, according to PwC.
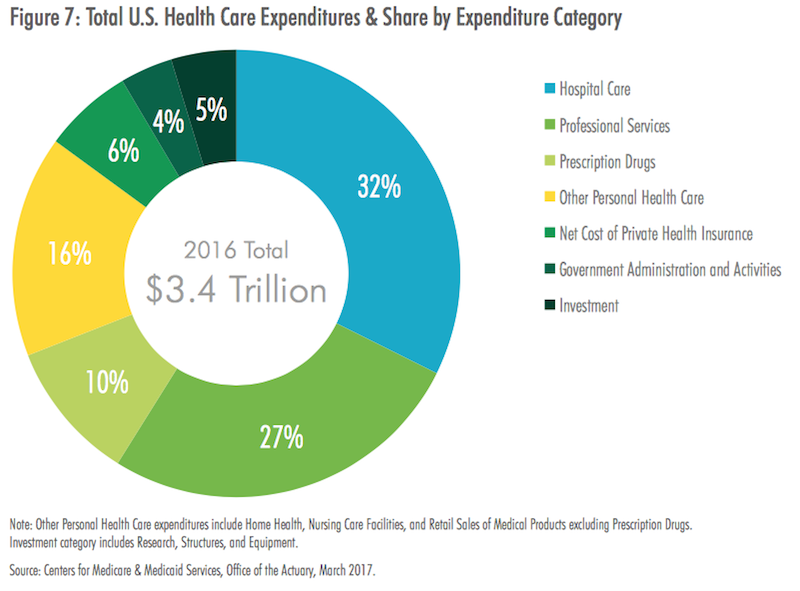
Outpatient professional services are not as expensive as hospital care, but they still accounted for nealry $900 billion in 2016. Image: CBRE.
Overall asking rents for medical office properties have remained relatively stable over the past seven years, ranging between $22 and $23 per sf per year. CBRE explains that the high cost of tenant build-outs, as well as the importance of proximity to a provider’s patient base and ancillary medical services, compel many tenants to remain in place for long periods of time.
But rent appreciation varies widely by market; average rents in New York, for example, grew by 83% since Q1 2010 to over $68 per sf in Q1 2017. Indeed, almost all of the 30 markets examined registered rent increases over the past year. And investors surveyed expect MOB rents to increase between 1% and 3% this year.
Low vacancy rates in this sector are attributed, in part, to the widening gap between completions and absorptions over the past three years.
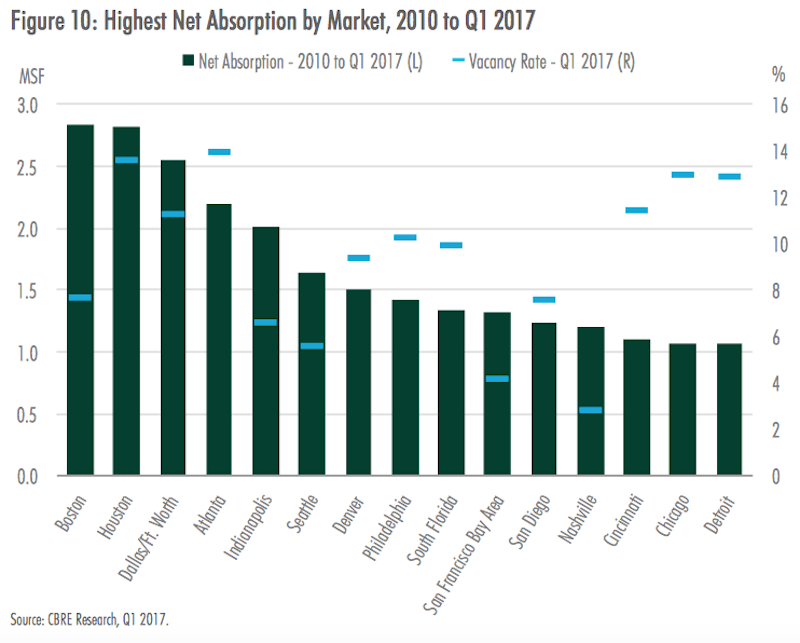
On a yearly basis, net absorption has been increasing since 2011 when it totaled 8.1 million sf. Since then, annual absorption grew by 114% to 17.2 million sf in 2016. Four of the five markets with the most positive net absorption in 2016 were located in the South or West: Houston (436,300 sf) Tampa (413,800 sf) Phoenix (314,400 sf) and South Florida (310,703 sf). Indianapolis was the lone top market not located in the Sun Belt, ranking third with 383,700 sf of positive absorption.
This chart compares cities' net absorptions of MOBs with their vacancy rates for that building type. Image: CBRE
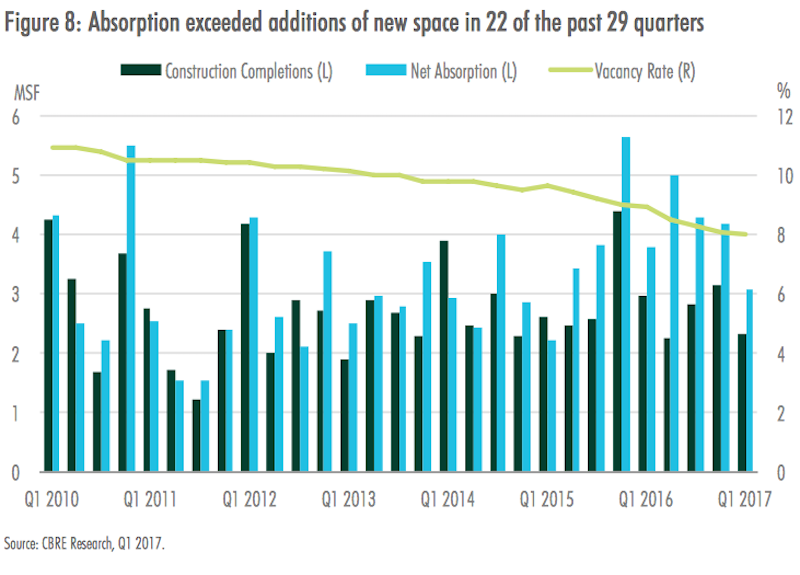
New construction of MOBs is not keeping up with demand, based on net absorption rates for 30 large metros. Image: CBRE
CBRE found that as investors’ appetites for healthcare-related properties have increased, MOBs “have emerged as the most popular property type within the niche.” Ninety-seven percent of investors surveyed in 2017 were most interested in medical office properties among all health care-related real estate that met their investment criteria.
CBRE cites Real Capital Analytics research that estimates total U.S. investment volume in MOBs of at least 10,000 sf at $10.2 billion in 2016, compared to just under $4 billion in 2010. The investment total in 2016 exceeded the previous annual peak of $7.3 billion in 2006.
The Southeast and Western regions have captured a combined 44% of total MOB investment since 2010. California accounted for 56% of the western region MOB investment, with Greater Los Angeles alone representing 37% of the region’s total.
Consolidation has been a major driver of new medical office construction in recent years, as many markets lacked enough large blocks of space to meet the requirements of newly expanded health care provider groups, particularly within close to hospital campuses.
Construction has been abetted by the healthcare systems’ focus on value-based care rather than a fee-for-service approach, which has amplified the need for effective communication across provider teams, driving the need for efficient space that facilitates collaboration.
Over the past two years, completions were highest in the medical hubs of Boston and Houston, each with more than 1.2 million sf of new product delivered. Conversely, only four of the 30 markets analyzed—New York, San Francisco, Orange County, Calif., and Louisville—have had no new completions since Q2 2015.
Related Stories

| Sep 13, 2010
Data Centers Keeping Energy, Security in Check
Power consumption for data centers doubled from 2000 and 2006, and it is anticipated to double again by 2011, making these mission-critical facilities the nation's largest commercial user of electric power. With major technology companies investing heavily in new data centers, it's no wonder Building Teams see these mission-critical facilities as a golden opportunity, and why they are working hard to keep energy costs at data centers in check.
| Aug 11, 2010
Green Guide for Health Care launches pilot program, looks for participants
In first quarter 2010, the Green Guide for Health Care, in collaboration with Practice Greenhealth, is launching a one-year Green Guide for Health Care Operations Pilot Program for healthcare organizations engaged in any or all aspects of green operations initiatives, based on Green Guide v2.2 Operations section.
| Aug 11, 2010
JE Dunn, Balfour Beatty among country's biggest institutional building contractors, according to BD+C's Giants 300 report
A ranking of the Top 50 Institutional Contractors based on Building Design+Construction's 2009 Giants 300 survey. For more Giants 300 rankings, visit http://www.BDCnetwork.com/Giants
| Aug 11, 2010
EwingCole to merge with healthcare specialist Robert D. Lynn Associates
EwingCole, a nationally recognized architectural, engineering, interior design, and planning firm with more than 320 professionals, today announced that it will combine its practice with Robert D. Lynn Associates of Philadelphia, a 40-person firm with a robust portfolio of healthcare projects. The combination will create the Delaware Valley¹s largest and most comprehensive firm with an emphasis on healthcare architecture, and a national scope and presence.
| Aug 11, 2010
Jacobs, Arup, AECOM top BD+C's ranking of the nation's 75 largest international design firms
A ranking of the Top 75 International Design Firms based on Building Design+Construction's 2009 Giants 300 survey. For more Giants 300 rankings, visit http://www.BDCnetwork.com/Giants
| Aug 11, 2010
Architecture Billings Index flat in May, according to AIA
After a slight decline in April, the Architecture Billings Index was up a tenth of a point to 42.9 in May. As a leading economic indicator of construction activity, the ABI reflects the approximate nine to twelve month lag time between architecture billings and construction spending. Any score above 50 indicates an increase in billings.
| Aug 11, 2010
Construction employment declined in 333 of 352 metro areas in June
Construction employment declined in all but 19 communities nationwide this June as compared to June-2008, according to a new analysis of metropolitan-area employment data released today by the Associated General Contractors of America. The analysis shows that few places in America have been spared the widespread downturn in construction employment over the past year.
| Aug 11, 2010
Jacobs, Hensel Phelps among the nation's 50 largest design-build contractors
A ranking of the Top 50 Design-Build Contractors based on Building Design+Construction's 2009 Giants 300 survey. For more Giants 300 rankings, visit http://www.BDCnetwork.com/Giants
| Aug 11, 2010
VA San Diego Healthcare System Building 1 Seismic Correction
San Diego, Calif.
Three decades after its original construction in the early 1970s, the Veterans Affairs San Diego Healthcare System Building 1 fell far short of current seismic codes. This not only put the building and its occupants—patients, doctors, nurses, visitors, and administrative staff—at risk in the event of a major earthquake, it violated a California state mandate requiring all hospitals to either retrofit or rebuild.
| Aug 11, 2010
HDR, Perkins+Will top BD+C's ranking of the nation's 100 largest healthcare design firms
A ranking of the Top 100 Healthcare Design Firms based on Building Design+Construction's 2009 Giants 300 survey. For more Giants 300 rankings, visit http://www.BDCnetwork.com/Giants


