
Washington, D.C., February 7, 2011 – The NAIOP Research Foundation released the Industrial Space Demand Forecast, a new study and model created for NAIOP that predicts future demand for industrial real estate by analyzing various economic factors and net absorption data.
According to the data:
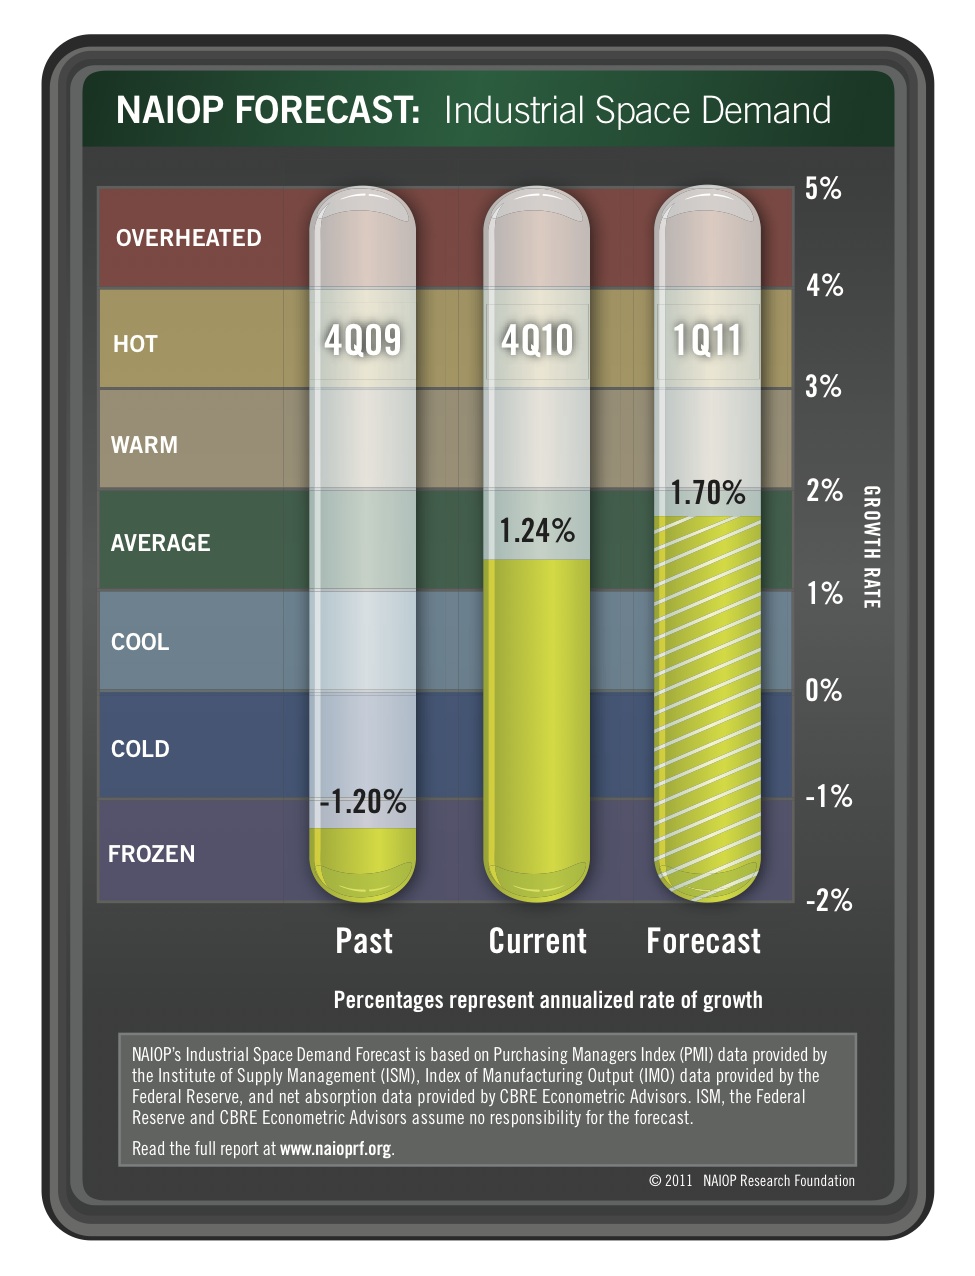
- The current annualized rate of growth (4Q2010) is 1.24%, which is in line with the historical average of 1 to 2 percent.
- Prior to 3Q2010, industrial space demand had been in “contraction mode” marked by seven consecutive quarters of negative demand for industrial space. In 4Q09, demand declined at an average annualized rate of 1.2%, which was below the rate of decline in the prior quarters of 2009.
- The two main variables used in the calculation – Purchasing Manager Index and Index of Manufacturing Output (see below for details) – are strong and suggest positive increases in demand during the next several quarters.
- Two of the demand drivers (PMI-Employment and PMI-Inventory) are currently ranging from average to strong however; they are trending down from previous quarters, suggesting the industrial market is unlikely to expand exceptionally until the overall economy becomes more robust.
- The remaining demand drivers (PMI-New Orders, PMI-Production and PMI-Deliveries) are currently ranging from average to strong and are trending up, which suggest an increasing demand for industrial space.
- The outlook for demand of industrial space is similar to the overall outlook for the economy – in that markets are stabilizing and beginning the process recovery. However, in the early phase of a recovery period, markets remain sensitive to exogenous shocks and events.
- Therefore, demand for industrial space in 1Q2011 is projected to grow at a 1.70% annualized rate, which is on par with historical averages suggesting that the sector is improving.
Issued quarterly, the NAIOP Industrial Space Demand Forecast is based on Purchasing Manager Index (PMI) data provided by the Institute of Supply Management (ISM), Index of Manufacturing Output (IMO) data provided by the Federal Reserve, and net absorption data provided by CBRE Econometric Advisors.
“Industrial property investors, lenders and forecasters have an explicit need for a concise measurement for industrial space demand, and this new forecast provides that data in a snap-shot format,” said Thomas J. Bisacquino, NAIOP president and CEO. “The upward trend demonstrates renewed confidence and increased activity in the industrial market, and the data provides valuable information for the developers and financiers to make better transaction decisions.”
The data and analysis are detailed in “Industrial Space Demand,” a report co-authored by Dr. Randy Anderson, University of Central Florida, and Dr. Hany Guirguis, Manhattan College, and funded by the NAIOP Research Foundation. To read the complete White Paper regarding the methodology of the Forecast, visit the Research Foundation Web site www.naioprf.org.
Methodology for Industrial Space Demand Forecast Model
Drs. Anderson and Guirguis developed the forecasting model for the demand of industrial space at the national level. Utilizing variables that comprise the entire supply chain and lead the demand for space, the model is able to capture the majority of changes in demand.
While leading economic indicators have been able to forecast recessions and expansions, the indices used in this study are constructed to forecast industrial real estate demand expansions, peaks, declines and troughs. The Industrial Space Demand model was developed using the Kalman Filter approach, where the regression parameters are allowed to vary with time and thus are more appropriate for an unstable industrial real estate market.
This research initially examined nearly 40 real estate, economic and stock market variables that should theoretically be related to demand for industrial space. These variables included measures of employment, GDP, exports and imports, as well as air, rail and shipping data. Two variables, the Federal Reserve Board’s Index of Manufacturing Output (IMO) and the PMI Index from the Institute for Supply Chain Management PMI (ISMPMI), capture the majority of the variation in demand and the entire supply chain.
The IMO is released monthly by the Federal Reserve Board of Governors. The index measures the quality of goods produced, excluding mining and utilities. The ISMPMI is constructed using a survey of purchasing managers’ expectations. The Institute’s monthly survey has five components: new orders, production, employment, deliveries and inventories. ISMPMI leads the IMO and is a leading indicator of production in the industrial sector, followed by the actual goods that are produced, which are portrayed and captured in the IMO data. The information leads firms in their decision making on how much industrial real estate they will demand.


