The Architecture Billings Index (ABI) recorded its sixth consecutive positive month, according to a new report today from The American Institute of Architects (AIA).
The ABI score for July was 54.6. While this was down slightly from June’s score of 57.1, it still indicates very strong business conditions overall (any score above 50 indicates an increase in billings from the prior month). Scoring for new project inquiries also declined in July but remained near its all-time high at 65.0. The score for new design contracts was essentially unchanged from June to July with a score of 58.0.
“In prior business cycles, architecture firms generally saw their project work soften quickly and then recover slowly,” said AIA Chief Economist, Kermit Baker, Hon. AIA, PhD. “So the strength of this recovery is unprecedented. Firm leaders who have leaned into this economic upturn by reinvesting in their firms by hiring staff and upgrading their technology, will likely have a better year than those that anticipated a slower recovery.”
Key ABI highlights for July include:
- Regional averages: Midwest (58.3); West (56.0); South (54.6); Northeast (54.1)
- Sector index breakdown: commercial/industrial (58.4); institutional (55.4); multi-family residential (54.7); mixed practice (54.4)
The regional and sector categories are calculated as a three-month moving average, whereas the national index, design contracts and inquiries are monthly numbers.
To learn more about recent economic developments impacting design and construction, visit AIA’s website.
Related Stories
Market Data | Apr 16, 2019
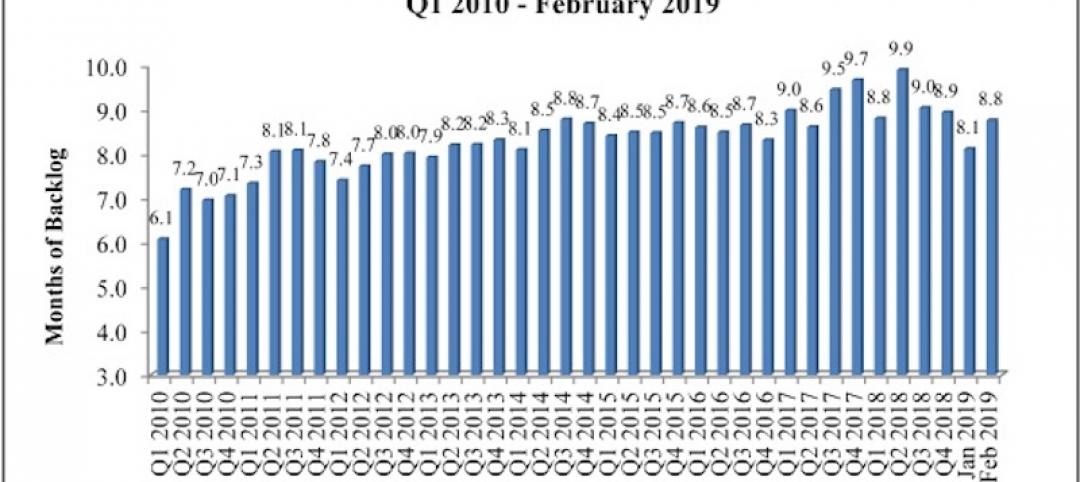
ABC’s Construction Backlog Indicator rebounds in February
ABC's Construction Backlog Indicator expanded to 8.8 months in February 2019.
Market Data | Apr 8, 2019
Engineering, construction spending to rise 3% in 2019: FMI outlook
Top-performing segments forecast in 2019 include transportation, public safety, and education.
Market Data | Apr 1, 2019
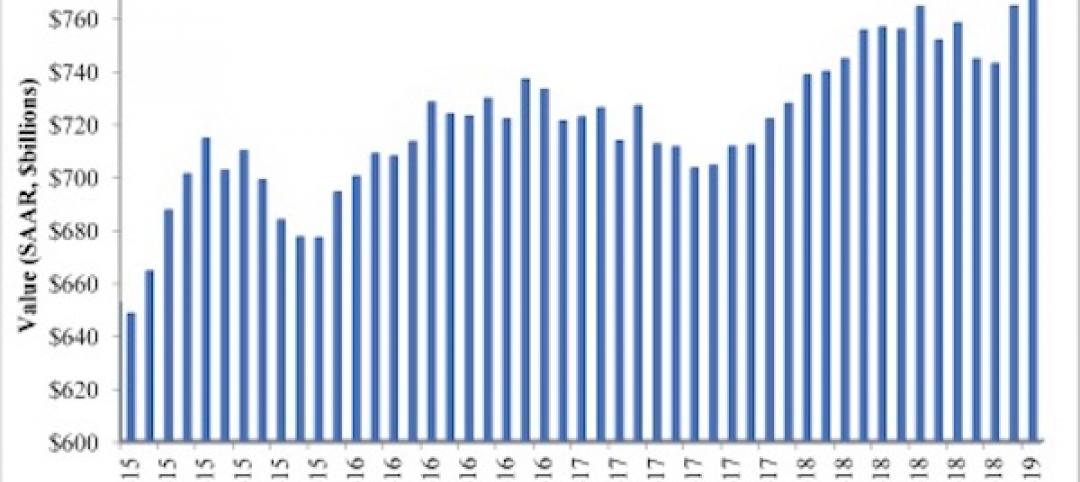
Nonresidential spending expands again in February
Private nonresidential spending fell 0.5% for the month and is only up 0.1% on a year-over-year basis.
Market Data | Mar 22, 2019
Construction contractors regain confidence in January 2019
Expectations for sales during the coming six-month period remained especially upbeat in January.
Market Data | Mar 21, 2019
Billings moderate in February following robust New Year
AIA’s Architecture Billings Index (ABI) score for February was 50.3, down from 55.3 in January.
Market Data | Mar 19, 2019
ABC’s Construction Backlog Indicator declines sharply in January 2019
The Construction Backlog Indicator contracted to 8.1 months during January 2019.
Market Data | Mar 15, 2019
2019 starts off with expansion in nonresidential spending
At a seasonally adjusted annualized rate, nonresidential spending totaled $762.5 billion for the month.
Market Data | Mar 14, 2019
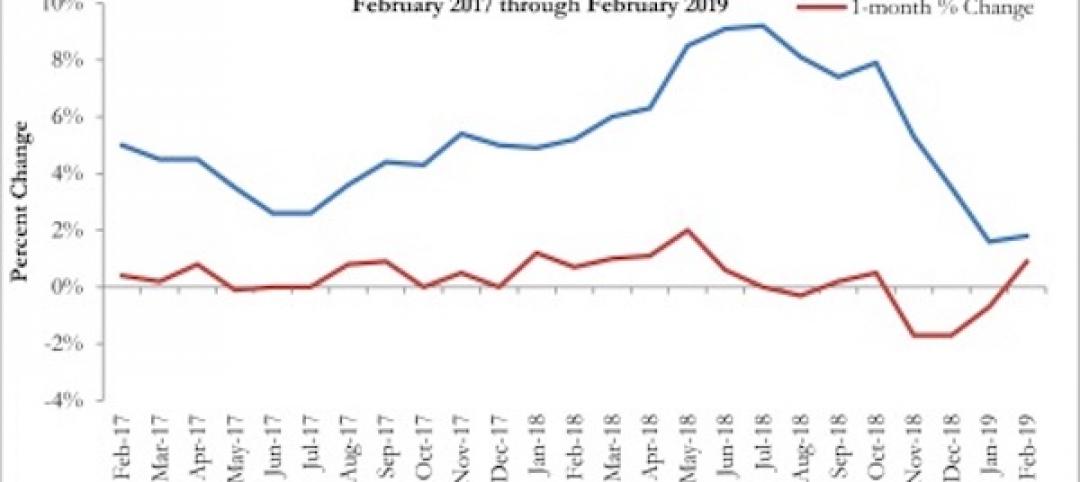
Construction input prices rise for first time since October
Of the 11 construction subcategories, seven experienced price declines for the month.
Market Data | Mar 6, 2019
Global hotel construction pipeline hits record high at 2018 year-end
There are a record-high 6,352 hotel projects and 1.17 million rooms currently under construction worldwide.
Market Data | Feb 28, 2019
U.S. economic growth softens in final quarter of 2018
Year-over-year GDP growth was 3.1%, while average growth for 2018 was 2.9%.


