


In the recent U.S. Construction Pipeline Trend Report released by Lodging Econometrics (LE), at the close of the fourth quarter of 2021, Dallas leads the U.S. markets in the number of pipeline projects with 152 projects/18,180 rooms. Following Dallas, the U.S. markets with the largest total hotel construction pipelines by project count are Atlanta, at a cyclical high, with 133 projects/17,593 rooms; New York City with 121 projects/19,303 rooms; Los Angeles with 120 projects/19,815 rooms; and Houston, with 91 projects/9,912 rooms.
Despite the impact COVID-19 has had on hotel development, three markets in the U.S. announced more than 10 new construction projects in Q4‘21. Miami had the highest number of new projects announced into the pipeline with 17 projects/2,797 rooms. Following Miami is Dallas with 13 projects/1,308 rooms, and then Orlando with 11 projects/1,791 rooms.
The market with the greatest number of projects already in the ground, at the end of the fourth quarter, is New York with 90 projects/14,513 rooms. Following distantly are Dallas with 28 projects/3,945 rooms, Austin with 28 projects/3,706 rooms, Atlanta with 26 projects/4,120 rooms, and Detroit with 23 projects under construction, accounting for 2,432 rooms. These five markets collectively account for 20% of the total number of projects currently under construction in the U.S.
Dallas has the most projects scheduled to start in the next 12 months, with 51 projects/5,989 rooms. Behind Dallas are Atlanta with 51 projects/5,989 rooms; Houston, with 42 projects/4,107 rooms; Los Angeles with 41 projects/6,278 rooms; and Phoenix with 38 projects/4,401 rooms. Dallas also has the largest number of projects in early planning, at the end of Q4’21, with 73 projects/8,246 rooms. Los Angeles follows with 57 projects/9,907 rooms; Atlanta 56 projects/6,561 rooms; Orlando 45 projects/7,896 rooms; and Nashville 38 projects/4,680 rooms.
The top 50 markets saw 449 hotels/63,742 rooms open in 2021. LE is forecasting these same 50 markets to open another 446 projects/57,837 rooms in 2022 for a 2.2% growth rate, and 421 projects/52,460 rooms in 2023 for a growth rate of 1.9%.
Moving into the New Year, an important metric to monitor will be markets with large construction pipelines as compared to their existing census of open & operating hotels. These markets are likely to see the fastest supply growth and largest supply-demand variances over the next few years. At the end of 2021, there were 17 markets with total pipelines in excess of 15% of their current census. Raleigh-Durham tops this list at 24.1%, followed by Miami, Fort Worth-Arlington, Austin, and then Memphis at 22.1%.
The markets topping the forecast for new hotel openings in 2022 will be New York City with 48 new hotels/6,656 rooms for a 5.4% growth rate, Atlanta with 22 projects/2,398 rooms for a 2.1% growth rate, Dallas with 21 projects/2,522 rooms for a 2.4% growth rate, and Austin with 20 projects/2,722 rooms for a 5.9% growth rate. LE expects a 2.1% average growth rate for the top 25 markets in 2022 and, come 2023, these top 25 markets will experience an average growth rate of 1.9%. New York will again top the charts in 2023 for new hotel openings. LE anticipates New York will open 42 new hotels, accounting for 7,058 rooms, again for a 5.4% growth rate, followed by Atlanta 21 projects/3,664 rooms for a 3.2% growth rate, and Dallas with 21 new opens/2,318 rooms for a growth rate of 2.2%.
Related Stories
Market Data | Nov 10, 2021
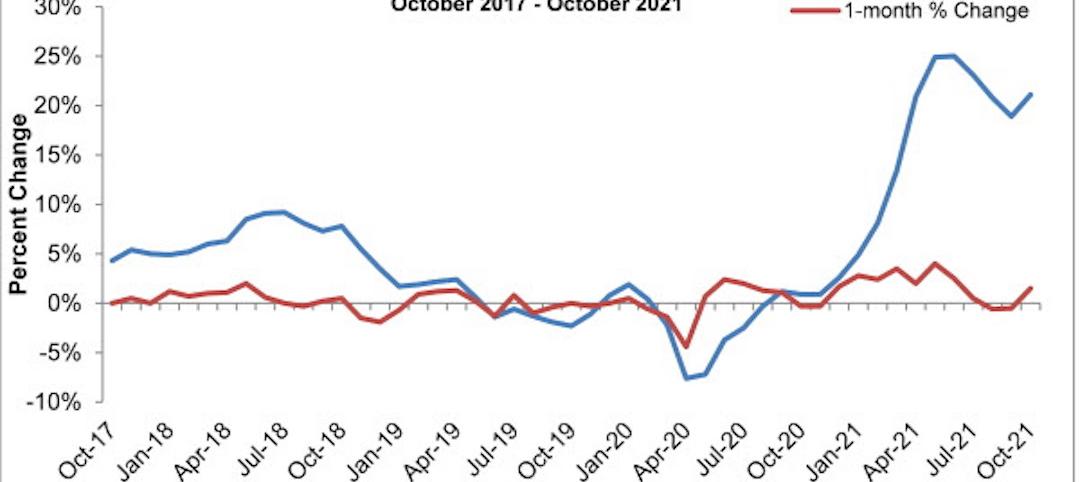
Construction input prices see largest monthly increase since June
Construction input prices are 21.1% higher than in October 2020.
Market Data | Nov 9, 2021
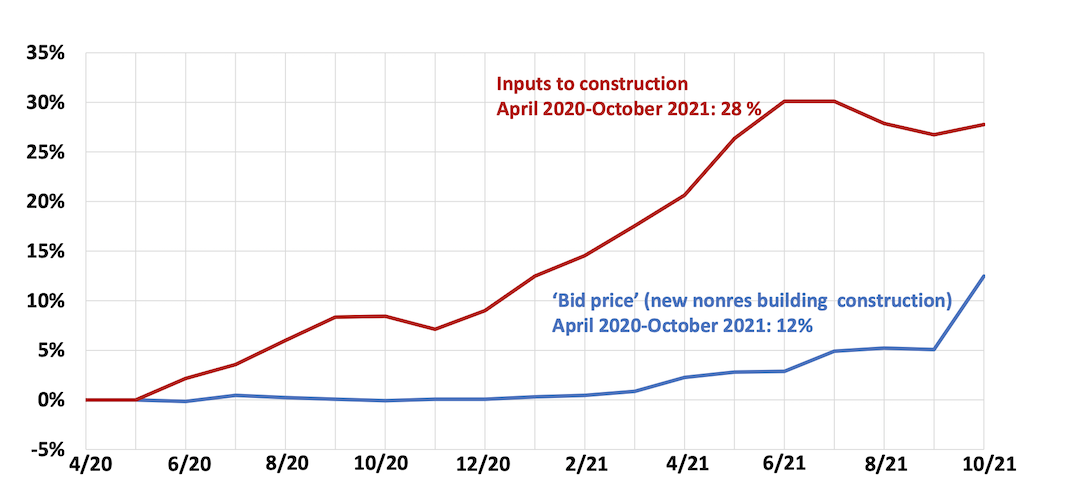
Continued increases in construction materials prices starting to drive up price of construction projects
Supply chain and labor woes continue.
Market Data | Nov 5, 2021
Construction firms add 44,000 jobs in October
Gain occurs even as firms struggle with supply chain challenges.
Market Data | Nov 3, 2021
One-fifth of metro areas lost construction jobs between September 2020 and 2021
Beaumont-Port Arthur, Texas and Sacramento--Roseville--Arden-Arcade Calif. top lists of gainers.
Market Data | Nov 2, 2021
Construction spending slumps in September
A drop in residential work projects adds to ongoing downturn in private and public nonresidential.

Hotel Facilities | Oct 28, 2021
Marriott leads with the largest U.S. hotel construction pipeline at Q3 2021 close
In the third quarter alone, Marriott opened 60 new hotels/7,882 rooms accounting for 30% of all new hotel rooms that opened in the U.S.

Hotel Facilities | Oct 28, 2021
At the end of Q3 2021, Dallas tops the U.S. hotel construction pipeline
The top 25 U.S. markets account for 33% of all pipeline projects and 37% of all rooms in the U.S. hotel construction pipeline.

Market Data | Oct 27, 2021
Only 14 states and D.C. added construction jobs since the pandemic began
Supply problems, lack of infrastructure bill undermine recovery.

Market Data | Oct 26, 2021
U.S. construction pipeline experiences highs and lows in the third quarter
Renovation and conversion pipeline activity remains steady at the end of Q3 ‘21, with conversion projects hitting a cyclical peak, and ending the quarter at 752 projects/79,024 rooms.

Market Data | Oct 19, 2021
Demand for design services continues to increase
The Architecture Billings Index (ABI) score for September was 56.6.


