

The United States is leading the way in Energy and Environmental Design (LEED) green buildings, according to new research by Uswitch.com, the comparison and switching service.
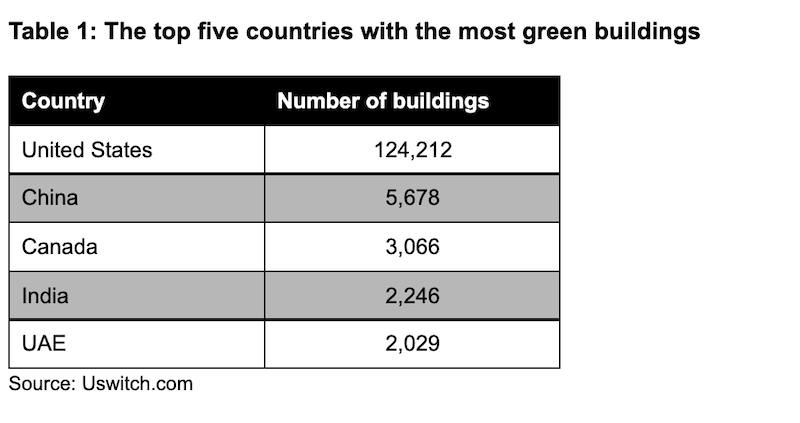
As the country that set up the LEED initiative, the US is a natural leader in constructing green buildings, with 124,200 (124,212) LEED-certified buildings - the most overall in the world. China has over 100,000 fewer buildings than the US, with 5,700 (5,678). However, they still come in second place for the most green buildings. In third place is Canada with just over 3,000 (3,066) green buildings.
The US Green Building Council (USGBC) reports that 40% of worldwide energy usage comes from the construction industry, with it estimated to increase by 1.8% by 2030. With that said, business owners can now achieve LEED-certified buildings, which is an establishment that recognises healthy, highly efficient and cost-saving green buildings.
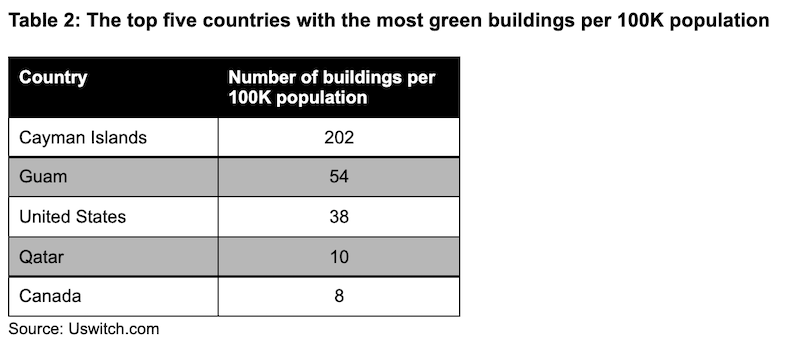
To put the buildings in each country into perspective, Uswitch compared the numbers to every 100K of the population.
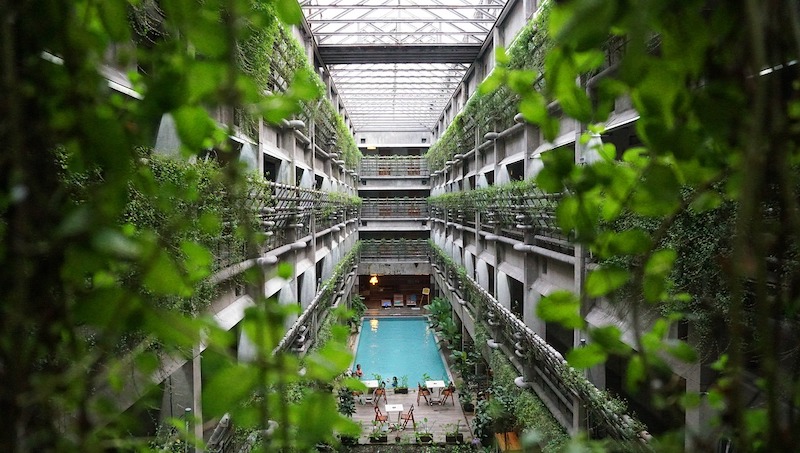
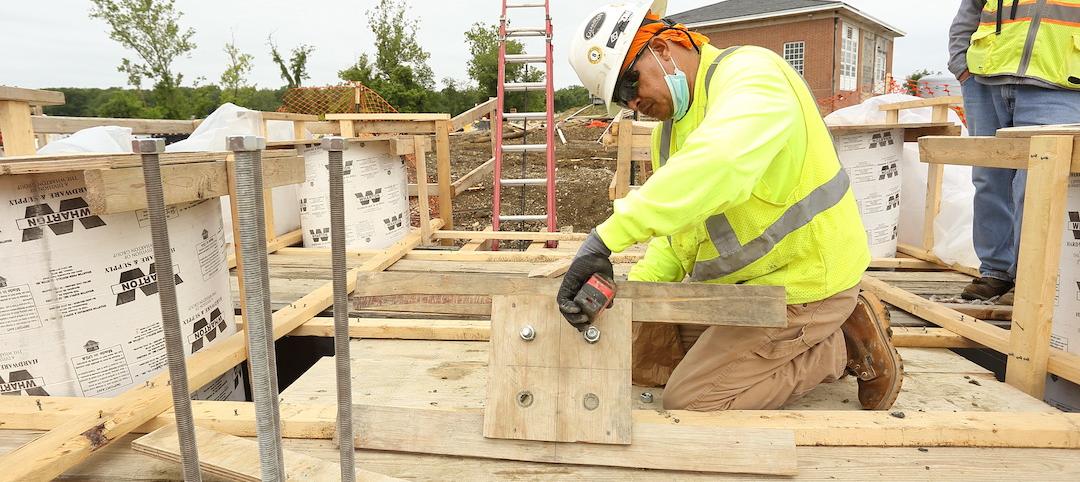
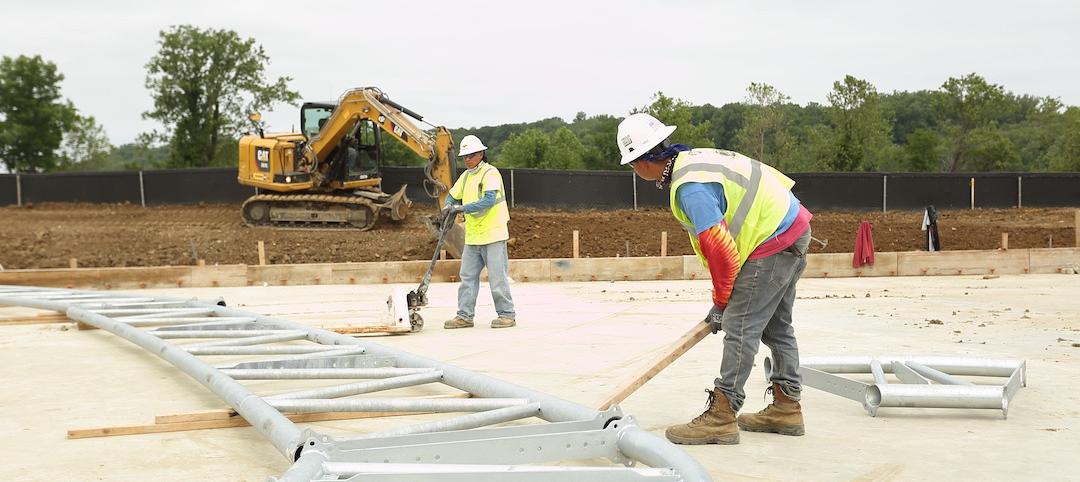
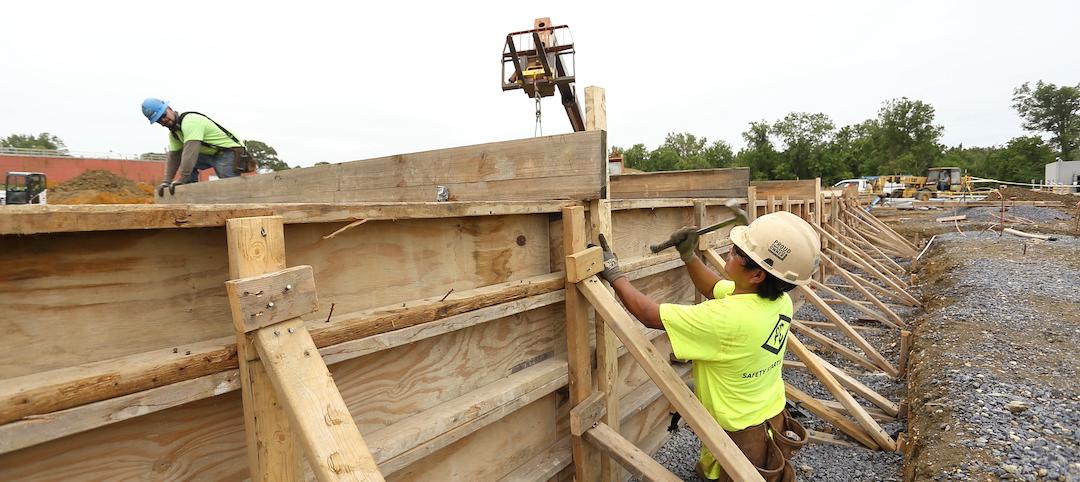
Characteristics of a green building include being in close proximity to public transport to reduce carbon footprint, efficient use of water to reduce the building’s water usage, recycling systems, as well as air cleanliness and noise pollution.
There are different types of buildings that are LEED-rated and are leading the way in sustainability, from the likes of education, healthcare, hospitality, industrial and residential buildings.
If living in a city that is sustainably-aware and is making an effort to reduce carbon emissions is of importance - like it is for many nowadays - the following cities are leading the way with green construction.
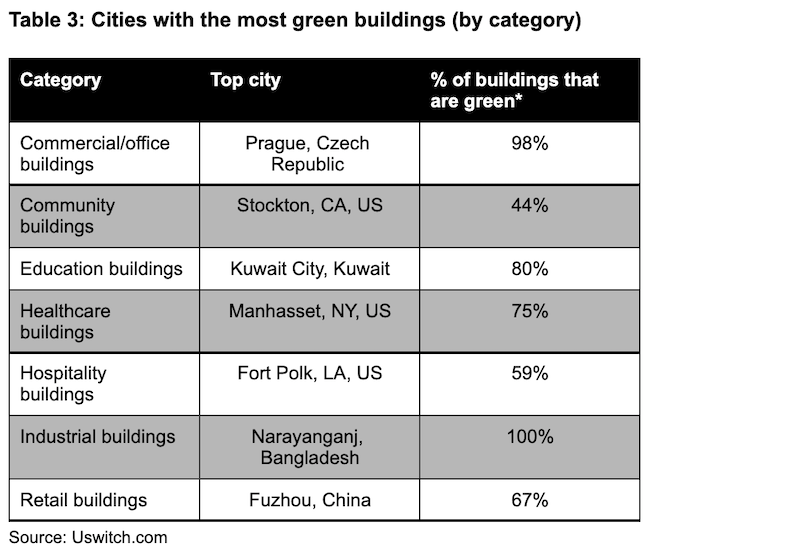
All of the industrial buildings in Narayanganj, Bangladesh, are green-certified. Nearly all (98%) of Prague, Czech Republic’s LEED-certified buildings are used for offices. Following this, 75% of healthcare buildings in Manhasset, United States, are green.
-
Country and city totals were compiled based on the LEED Projects Directory as maintained by the U.S. Green Buildings Council. LEED projects were classified by their end use on the basis of the first use category listed in the "Project Type" field in the Projects Directory database. "Other/Unknown" category incorporates projects that weren't numerous enough to warrant their own category, i.e. "Military" and projects where the type was labeled as "Other" or "Unknown". Projects that were in their planning phase (e.g. designated under LEED-ND), rather than being completed, were excluded from the dataset. Country populations were taken from the World Bank's "Population, Total" indicator. City populations were obtained from Simple Maps "US Cities" and "World Cities" datasets. State populations were taken from the U.S. Census Bureau. Only countries with 50 or more LEED projects were included. Only cities with 20 or more LEED projects were included. LEED projects, where location was listed as "Confidential" or partial, i.e. only indicating country or its subdivision (state, province), but specifying country were included in the country totals, but excluded from city totals. Data was collated in Apr 2021.
-
Source: Gocontractor.com: How does construction impact the environment?
-
Source: Iberdrola.com: The 'green' buildings are leading the way to more sustainable and efficient urban planning
Related Stories
Market Data | Oct 19, 2021
Demand for design services continues to increase
The Architecture Billings Index (ABI) score for September was 56.6.
Market Data | Oct 14, 2021
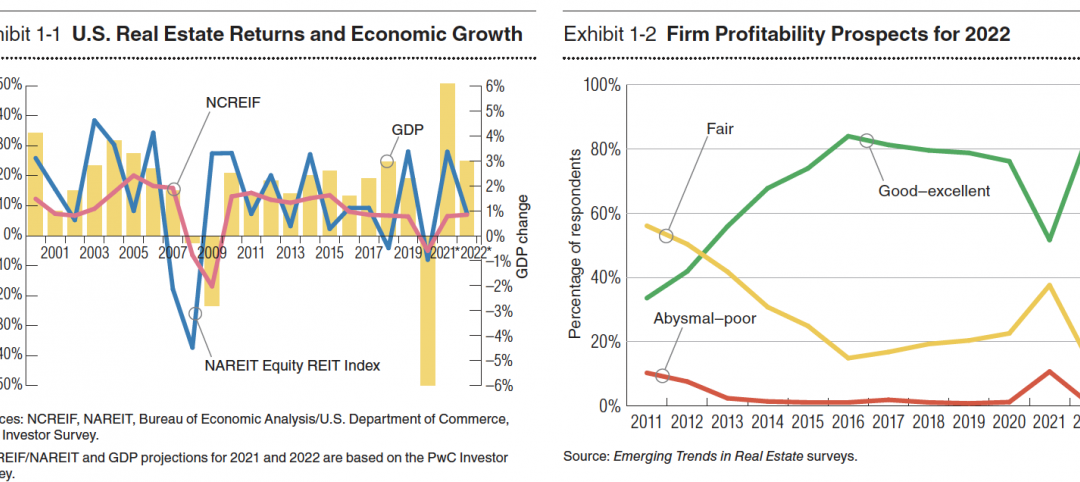
Climate-related risk could be a major headwind for real estate investment
A new trends report from PwC and ULI picks Nashville as the top metro for CRE prospects.
Market Data | Oct 14, 2021
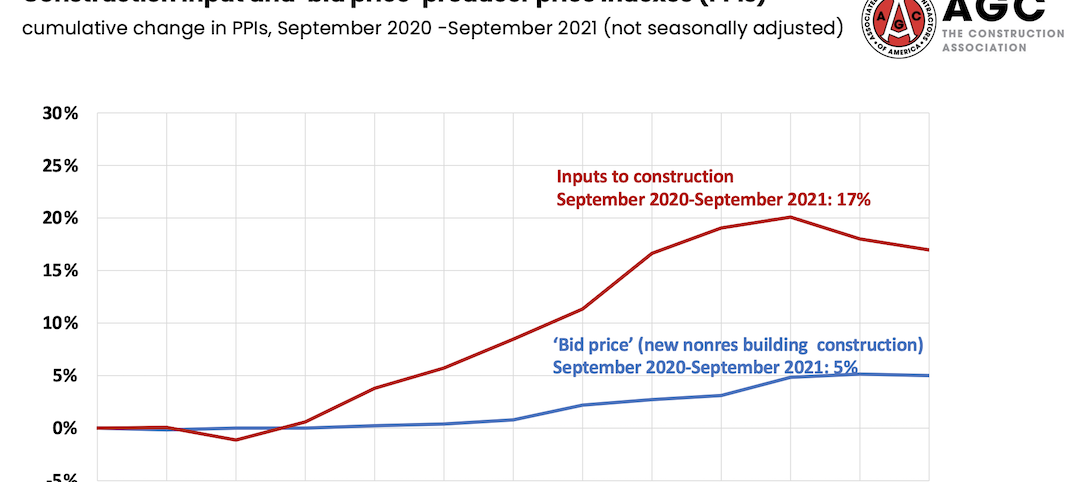
Prices for construction materials continue to outstrip bid prices over 12 months
Construction officials renew push for immediate removal of tariffs on key construction materials.
Market Data | Oct 11, 2021
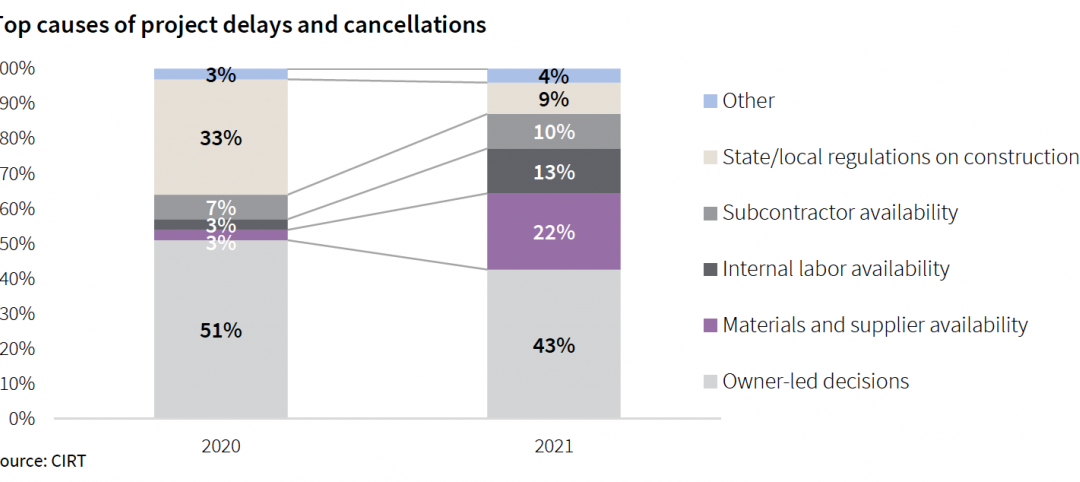
No decline in construction costs in sight
Construction cost gains are occurring at a time when nonresidential construction spending was down by 9.5 percent for the 12 months through July 2021.
Market Data | Oct 11, 2021
Nonresidential construction sector posts first job gain since March
Has yet to hit pre-pandemic levels amid supply chain disruptions and delays.
Market Data | Oct 4, 2021
Construction spending stalls between July and August
A decrease in nonresidential projects negates ongoing growth in residential work.
Market Data | Oct 1, 2021
Nonresidential construction spending dips in August
Spending declined on a monthly basis in 10 of the 16 nonresidential subcategories.
Market Data | Sep 29, 2021
One-third of metro areas lost construction jobs between August 2020 and 2021
Lawrence-Methuen Town-Salem, Mass. and San Diego-Carlsbad, Calif. top lists of metros with year-over-year employment increases.
Market Data | Sep 28, 2021
Design-Build projects should continue to take bigger shares of construction spending pie over next five years
FMI’s new study finds collaboration and creativity are major reasons why owners and AEC firms prefer this delivery method.
Market Data | Sep 22, 2021
Architecture billings continue to increase
The ABI score for August was 55.6, up from July’s score of 54.6.


