

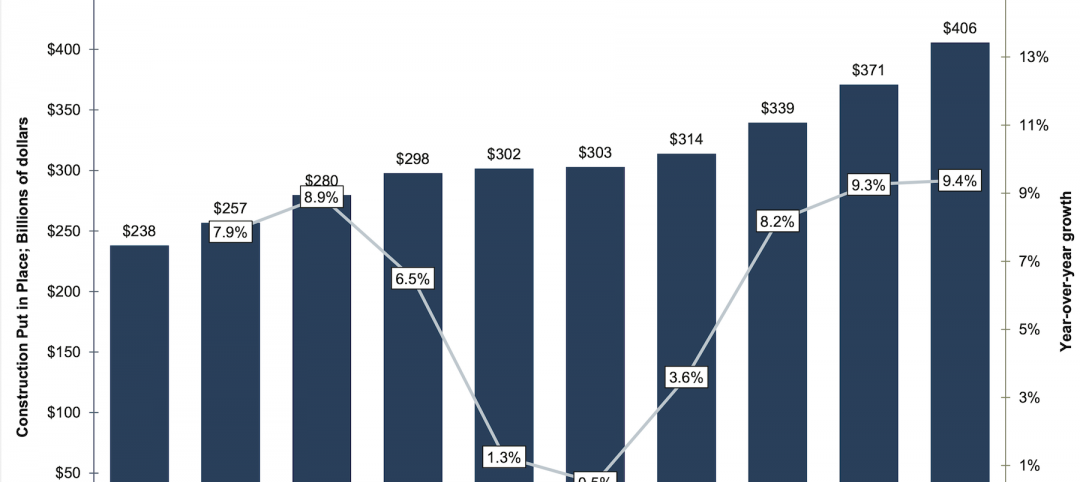
Thirty-nine states lost construction jobs between August 2019 and August 2020 while 31 states and the District of Columbia added construction jobs between July and August according to a new analysis of Labor Department data released today by the Associated General Contractors of America. The new annual figures detail how the coronavirus pandemic has undermined demand for construction projects after a strong start to the year.
“The ongoing pandemic is prompting ever more private owners, developers, and public agencies to delay and cancel projects,” said Ken Simonson, the association’s chief economist, citing the association’s mid-June survey and a more recent survey it produced in August. “The share of contractors that reported postponed or canceled projects nearly doubled while the share who reported winning new or expanded work dropped nearly in half.”
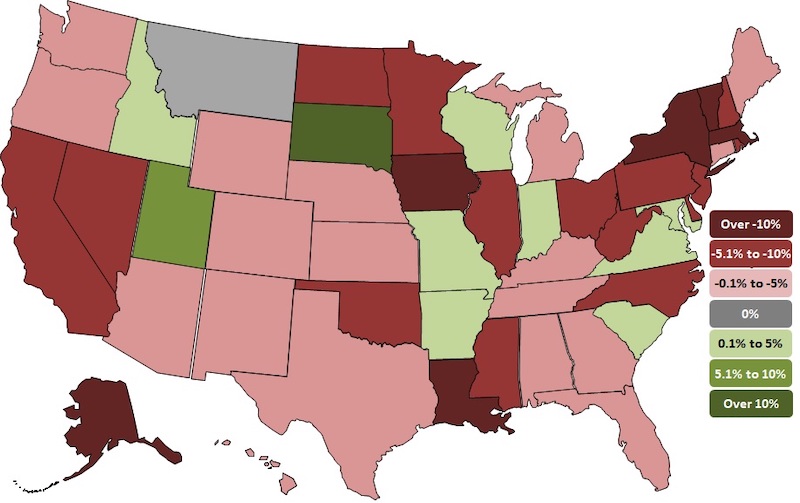
California lost the most construction jobs (-52,000, -5.8%) between August 2019 and August 2020, followed by New York (-46,000, -11.3%); Texas (-39,300 jobs, -5.0%); Massachusetts (-20,200 jobs, -12.4%) and Illinois (-17,200 jobs, -7.5%). Vermont lost the highest percent of construction jobs for the year (-29.6%, -4,500 jobs), followed by Massachusetts; Iowa (-11.8%, -9,300 jobs); Louisiana (-11.4%, -15,700 jobs) and New York.
Ten states and the District of Columbia added construction jobs between August 2019 and August 2020 while construction employment was unchanged in Montana. Utah added the most new construction jobs (8,800 jobs, 8.0%), followed by Virginia (4,400 jobs, 2.2%); Maryland (3,800 jobs, 2.3%); Indiana (3,100 jobs, 2.1%) and Missouri (2,700 jobs, 2.1%). South Dakota added the highest percent (10.9%, 2,600 jobs), followed by Utah; Idaho (2.4%, 1,300 jobs); Maryland and Virginia.
California added the most new construction jobs (6,700 jobs, 0.8%) between July and August, followed by New York (5,200 jobs, 1.5%); Pennsylvania (4,100 jobs, 1.7%); Texas (3,300 jobs, 0.4%) and Oregon (3,200 jobs, 3.1%). New Mexico added the highest percentage (6.7%, 3,100) of jobs for the month, followed by Mississippi (3.4%, 1,400 jobs); Oregon and Kentucky (2.0%, 1,600 jobs).
Nineteen states lost construction jobs for the month with Nevada losing the most (-2,600 jobs, -2.8%). Other states losing a high number of construction jobs for the month include Florida (-2,200 jobs, -0.4%); Nebraska (-1,800 jobs, -3.3%) and North Carolina (-1,800 jobs, -0.8%). Hawaii lost the highest percentage (-3.5%, -1,300 jobs) of construction jobs for the month, followed by West Virginia (-3.3%, -1,100 jobs); Nebraska and Nevada.
Association officials said the best thing Washington leaders can do to boost demand for construction and employment in the sector is to increase investments in infrastructure and provide liability protections for firms taking steps to protect workers from the coronavirus. They added that extending the current surface transportation bill for one-year – which appears likely to occur – will provide needed short-term certainty for the transportation construction market.
“The best way to create jobs and boost economic activity is to rebuild aging infrastructure, provide market certainty and protect firms from needless suits,” said Stephen E. Sandherr, the association’s chief executive officer.
View state employment data, 12-mo, 1-mo rankings, map and high and lows. View the workforce survey results.
Related Stories

Market Data | Oct 19, 2021
Demand for design services continues to increase
The Architecture Billings Index (ABI) score for September was 56.6.
Market Data | Oct 14, 2021
Climate-related risk could be a major headwind for real estate investment
A new trends report from PwC and ULI picks Nashville as the top metro for CRE prospects.
Market Data | Oct 14, 2021
Prices for construction materials continue to outstrip bid prices over 12 months
Construction officials renew push for immediate removal of tariffs on key construction materials.
Market Data | Oct 11, 2021
No decline in construction costs in sight
Construction cost gains are occurring at a time when nonresidential construction spending was down by 9.5 percent for the 12 months through July 2021.
Market Data | Oct 11, 2021
Nonresidential construction sector posts first job gain since March
Has yet to hit pre-pandemic levels amid supply chain disruptions and delays.
Market Data | Oct 4, 2021
Construction spending stalls between July and August
A decrease in nonresidential projects negates ongoing growth in residential work.
Market Data | Oct 1, 2021
Nonresidential construction spending dips in August
Spending declined on a monthly basis in 10 of the 16 nonresidential subcategories.
Market Data | Sep 29, 2021
One-third of metro areas lost construction jobs between August 2020 and 2021
Lawrence-Methuen Town-Salem, Mass. and San Diego-Carlsbad, Calif. top lists of metros with year-over-year employment increases.
Market Data | Sep 28, 2021
Design-Build projects should continue to take bigger shares of construction spending pie over next five years
FMI’s new study finds collaboration and creativity are major reasons why owners and AEC firms prefer this delivery method.
Market Data | Sep 22, 2021
Architecture billings continue to increase
The ABI score for August was 55.6, up from July’s score of 54.6.


