

Construction employment decreased from December 2019 to December 2020 in more than half of the nation’s metro areas despite a surge in homebuilding and remodeling, according to an analysis of new government data that the Associated General Contractors of America released today. Association officials said large numbers of contractors are having to lay off workers once they complete projects that began before the pandemic because private owners and public agencies are hesitant to commit to new construction.
“A dearth of new construction work is forcing more and more contractors to lay off employees once they complete projects started before the pandemic hit in early 2020,” said Ken Simonson, the association’s chief economist. “Private nonresidential construction spending tumbled 10% from December 2019 to December 2020 and public work has been slowing since last March, according to recent Census Bureau data.”
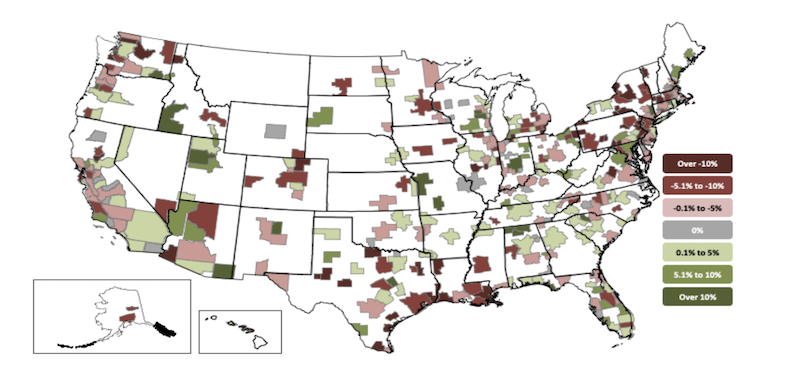
Construction employment fell in 191, or 53%, of 358 metro areas in 2020. Construction employment was stagnant in 33 additional metro areas, while only 134 metro areas—37%—added construction jobs between December 2019 and December 2020.
Houston-The Woodlands-Sugar Land, Texas lost the largest number of construction jobs in 2020 (-24,500 jobs, -10%), followed by New York City (-19,100 jobs, -12%); Midland, Texas (-9,200 jobs, -23%); Montgomery-Bucks-Chester counties, Pa. (-9,100 jobs, -17%); and Denver-Aurora-Lakewood, Colo. (-6,900 jobs, -6%). Brockton-Bridgewater-Easton, Mass. had the largest percentage decline (-40%, -2,100 jobs), followed by Altoona, Pa. (-34%, -1,000 jobs); Bloomsburg-Berwick, Pa. (-33%, -400 jobs); Johnstown, Pa. (-29%, -700 jobs); and East Stroudsburg, Pa. (-26%, -500 jobs).
Indianapolis-Carmel-Anderson, Ind. added the most construction jobs over the year (5,600 jobs, 10%), followed by Northern Virginia (5,300 jobs, 7%); Seattle-Bellevue-Everett, Wash. (4,900 jobs, 5%); Baltimore-Columbia-Towson, Md. (4,800 jobs, 6%); and Kansas City, Mo. (3,300 jobs, 11%). Walla Walla, Wash. had the highest percentage increase (17%, 200 jobs), followed by Fond du Lac, Wisc. (16%, 500 jobs); Springfield, Mo. (15%, 1,400 jobs); and Dutchess-Putnam counties, N.Y.
(15%, 1,300 jobs).
Association officials said job losses are likely to widen as demand for non-residential construction suffers and state and local budget challenges undermine demand for public projects. They urged Washington officials to begin work on recovery measures to fund infrastructure and shore up local construction budgets. They added that the work on these new investments should start even as negotiations on a coronavirus relief package continue.
“Helping people now is important but planning to rebuild our economy is essential to recovering from the economic pain of the pandemic,” said Stephen E. Sandherr, the association’s chief executive officer. “It is not enough to just want a better economy; you have to build it.”
View the metro employment 12-month data, rankings, top 10, new highs and lows, map.
Related Stories

Contractors | Feb 14, 2023
The average U.S. contractor has nine months worth of construction work in the pipeline
Associated Builders and Contractors reports today that its Construction Backlog Indicator declined 0.2 months to 9.0 in January, according to an ABC member survey conducted Jan. 20 to Feb. 3. The reading is 1.0 month higher than in January 2022.

Office Buildings | Feb 9, 2023
Post-Covid Manhattan office market rebound gaining momentum
Office workers in Manhattan continue to return to their workplaces in sufficient numbers for many of their employers to maintain or expand their footprint in the city, according to a survey of more than 140 major Manhattan office employers conducted in January by The Partnership for New York City.

Giants 400 | Feb 9, 2023
New Giants 400 download: Get the complete at-a-glance 2022 Giants 400 rankings in Excel
See how your architecture, engineering, or construction firm stacks up against the nation's AEC Giants. For more than 45 years, the editors of Building Design+Construction have surveyed the largest AEC firms in the U.S./Canada to create the annual Giants 400 report. This year, a record 519 firms participated in the Giants 400 report. The final report includes 137 rankings across 25 building sectors and specialty categories.

Multifamily Housing | Feb 7, 2023
Multifamily housing rents flat in January, developers remain optimistic
Multifamily rents were flat in January 2023 as a strong jobs report indicated that fears of a significant economic recession may be overblown. U.S. asking rents averaged $1,701, unchanged from the prior month, according to the latest Yardi Matrix National Multifamily Report.

Market Data | Feb 6, 2023
Nonresidential construction spending dips 0.5% in December 2022
National nonresidential construction spending decreased by 0.5% in December, according to an Associated Builders and Contractors analysis of data published today by the U.S. Census Bureau. On a seasonally adjusted annualized basis, nonresidential spending totaled $943.5 billion for the month.

Architects | Jan 23, 2023
PSMJ report: The fed’s wrecking ball is hitting the private construction sector
Inflation may be starting to show some signs of cooling, but the Fed isn’t backing down anytime soon and the impact is becoming more noticeable in the architecture, engineering, and construction (A/E/C) space. The overall A/E/C outlook continues a downward trend and this is driven largely by the freefall happening in key private-sector markets.

Hotel Facilities | Jan 23, 2023
U.S. hotel construction pipeline up 14% to close out 2022
At the end of 2022’s fourth quarter, the U.S. construction pipeline was up 14% by projects and 12% by rooms year-over-year, according to Lodging Econometrics.

Products and Materials | Jan 18, 2023
Is inflation easing? Construction input prices drop 2.7% in December 2022
Softwood lumber and steel mill products saw the biggest decline among building construction materials, according to the latest U.S. Bureau of Labor Statistics’ Producer Price Index.

Market Data | Jan 10, 2023
Construction backlogs at highest level since Q2 2019, says ABC
Associated Builders and Contractors reports today that its Construction Backlog Indicator remained unchanged at 9.2 months in December 2022, according to an ABC member survey conducted Dec. 20, 2022, to Jan. 5, 2023. The reading is one month higher than in December 2021.

Market Data | Jan 6, 2023
Nonresidential construction spending rises in November 2022
Spending on nonresidential construction work in the U.S. was up 0.9% in November versus the previous month, and 11.8% versus the previous year, according to the U.S. Census Bureau.


