

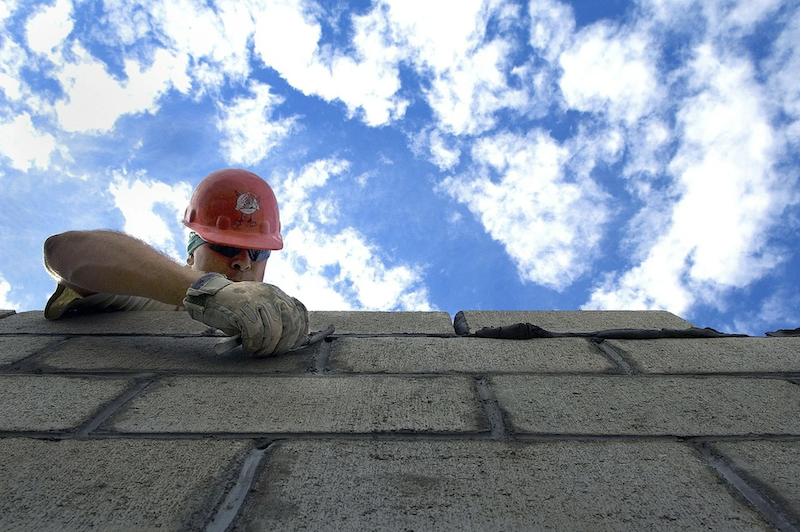
Construction employment in December remained below pre-pandemic levels in two-thirds of the states even though 37 states and the District of Columbia added construction jobs from November to December, according to an analysis by the Associated General Contractors of America of government employment data released today. Association officials said the new data highlights how broadly the industry has been impacted by the pandemic and underscores the need for additional coronavirus recovery measures.
“While most states recorded construction employment gains in December, the pickup is likely to be temporary for many,” said Ken Simonson, the association’s chief economist. “Participants in our association’s recent Hiring and Business Outlook Survey expect the dollar volume of most project types available to bid on to decline in 2021.”
The survey, which included responses from more than 1,300 contractors in every state and D.C., asked about prospects for 16 categories of projects. On balance, respondents expect growth only for non-hospital health care, such as clinics, testing and screening facilities, and medical laboratories; warehouses; and water and sewer projects.
Seasonally adjusted construction employment in December was lower than in February—the last month before the pandemic forced many contractors to suspend work—in 34 states and was unchanged in Kansas, Simonson noted. Texas lost the most construction jobs over the 10-month period (-35,600 jobs or -4.5%), followed by New York (-30,900 jobs, -7.5%), Florida (-17,500 jobs, -3.0%) and New Jersey (-16,700 jobs, -10.0%). Vermont experienced the largest percentage loss (-23.1%, -3,400 jobs), followed by New Jersey.
Only 15 states and the District of Columbia added construction jobs from February to December. Virginia added the most jobs (10,800, 5.3%), followed by Utah (7,000 jobs, 6.1%) and Alabama (6,100 jobs, 6.4%). Alabama added the highest percentage, followed by Utah and South Dakota (5.7%, 1,400 jobs).
Construction employment decreased from November to December in 11 states and D.C., increased in 37 states and was unchanged in North Carolina and Rhode Island. Arizona had the largest loss of construction jobs for the month (-4,100 jobs or -2.3%), followed by Louisiana (-2,000 jobs, -1.5%). Delaware had the largest percentage decline (3.2%, -700 jobs), followed by Arizona, Alaska (-1.9%, -300 jobs), and Louisiana.
California added the most construction jobs over the month (31,600 jobs, 3.7%), followed by New York (8,500, 2.3%) and Illinois (8,300 jobs, 3.8%). New Hampshire had the largest percentage gain for the month (4.0%, 1,100 jobs), followed by Illinois and New Mexico (3.8%, 1,800 jobs).
Association officials said demand for construction will continue to suffer until the coronavirus is under control and urged federal officials to enact measures to help stem additional job losses in the sector. These new measures should include new federal investments in infrastructure, backfilling depleted state and local construction budgets and moving quickly to forgive Paycheck Protection Program loans issued last year.
“Contractors are eager to save as many jobs as possible during the next several months on the expectation demand will return once the coronavirus comes under control,” said Stephen E. Sandherr, the association’s chief executive officer. “Washington officials can help save countless construction careers by acting now to stabilize demand.
View state employment February-December data and rankings; and November-December rankings.
Related Stories

Data Centers | Jan 28, 2016
Top 10 markets for data center construction
JLL’s latest outlook foresees a maturation in certain metros.

Market Data | Jan 20, 2016
Nonresidential building starts sag in 2015
CDM Research finds only a few positive signs among the leading sectors.
Market Data | Jan 20, 2016
Architecture Billings Index ends year on positive note
While volatility persists, architecture firms reported healthy performance for 2015.

Market Data | Jan 15, 2016
ABC: Construction material prices continue free fall in December
In December, construction material prices fell for the sixth consecutive month. Prices have declined 7.2% since peaking in August 2014.

Market Data | Jan 13, 2016
Morgan Stanley bucks gloom and doom, thinks U.S. economy has legs through 2020
Strong job growth and dwindling consumer debt give rise to hope.

Hotel Facilities | Jan 13, 2016
Hotel construction should remain strong through 2017
More than 100,000 rooms could be delivered this year alone.

Market Data | Jan 6, 2016
Census Bureau revises 10 years’ worth of construction spending figures
The largest revisions came in the last two years and were largely upward.

Market Data | Jan 5, 2016
Majority of AEC firms saw growth in 2015, remain optimistic for 2016: BD+C survey
By all indications, 2015 was another solid year for U.S. architecture, engineering, and construction firms.

Market Data | Jan 5, 2016
Nonresidential construction spending falters in November
Only 4 of 16 subsectors showed gains

Market Data | Dec 15, 2015
AIA: Architecture Billings Index hits another bump
Business conditions show continued strength in South and West regions.


