

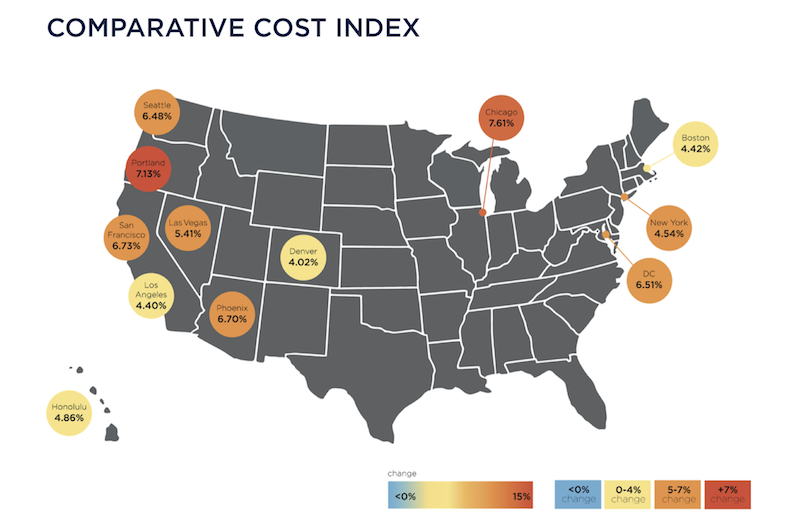
Construction costs nationally rose in 2018 by an average of 5.73%, with Chicago and Portland, Ore., showing the greatest increases among major cities.
Costs rose at a time when many markets are at or near their construction-activity cycle, and as industry unemployment remained higher than the country’s at large.
Those are two findings in the latest Quarterly Construction Cost Report for North America, released by the property and construction consultant Rider Levett Bucknall (RLB), and based on an analysis of 15 building typologies in 14 metros. (The sectors analyzed include single- and multifamily housing, as well as parking structures.)
The full quarterly report can be accessed here.
The U.S. Department of Commerce estimates that, as of January 2019, the seasonally adjusted annual rate for Construction Put-in-Place was just under $1.28 trillion, 0.3% above the same monthly estimate a year earlier.
However, the National Construction Cost Index has been on a fairly steady upward trajectory since the first quarter of 2014. As of the first quarter of 2019, that Index stood at 198.33 (relative to the April 2001 base of 100, recalibrated as of April 2011).
Some examples of RLB’s findings include its estimate that the cost of building prime office space is highest in Boston and New York, lowest in Phoenix and Denver. Los Angeles has the highest construction costs for hospitals, and Las Vegas the lowest for elementary schools.
Eight of the 14 markets analyzed were at their construction-activity peaks by the end of last year. Chicago’s construction costs, in general, increased the most (7.61%, to $22.8 billion) among the metros analyzed, even though it was the only city that fell into the “mid decline” category for construction activity. Honolulu, the only city in “trough growth,” saw construction costs rise by 4.86% to $24.8 billion.
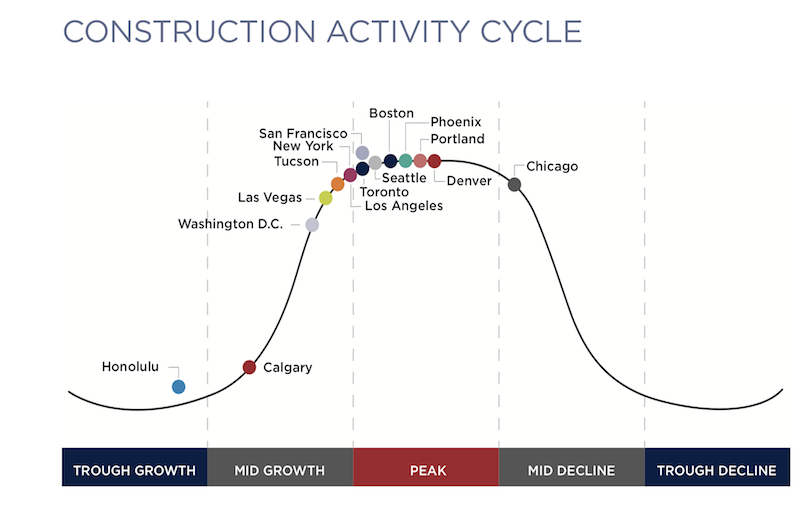 Eight of the 14 metros tracked are at the top of their constuction cycles. Image: RLB
San Francisco had the highest construction put-in-place, $26.844 billion, up 6.73%.
Increasingly expensive construction activity occurred despite a decrease in architectural billings, and an industry unemployment rate that, at 5.1% in the fourth quarter of last year, was down from 7.4% in the first quarter of 2018.
The U.S. Gross Domestic Product closed out the fourth quarter at 2.6%, down from a mid-year peak of 4.2%. Inflation last year was up only 1.91%.
The report also analyzes construction costs in Canada, specifically Calgary, Alberta, and Toronto, Ontario. RLB notes that those two cities are driving much of the growth in Canada’s economy.
Related Stories

Market Data | Apr 11, 2023
Construction crane count reaches all-time high in Q1 2023
Toronto, Seattle, Los Angeles, and Denver top the list of U.S/Canadian cities with the greatest number of fixed cranes on construction sites, according to Rider Levett Bucknall's RLB Crane Index for North America for Q1 2023.

Contractors | Apr 11, 2023
The average U.S. contractor has 8.7 months worth of construction work in the pipeline, as of March 2023
Associated Builders and Contractors reported that its Construction Backlog Indicator declined to 8.7 months in March, according to an ABC member survey conducted March 20 to April 3. The reading is 0.4 months higher than in March 2022.

Market Data | Apr 6, 2023
JLL’s 2023 Construction Outlook foresees growth tempered by cost increases
The easing of supply chain snags for some product categories, and the dispensing with global COVID measures, have returned the North American construction sector to a sense of normal. However, that return is proving to be complicated, with the construction industry remaining exceptionally busy at a time when labor and materials cost inflation continues to put pricing pressure on projects, leading to caution in anticipation of a possible downturn. That’s the prognosis of JLL’s just-released 2023 U.S. and Canada Construction Outlook.

Market Data | Apr 4, 2023
Nonresidential construction spending up 0.4% in February 2023
National nonresidential construction spending increased 0.4% in February, according to an Associated Builders and Contractors analysis of data published by the U.S. Census Bureau. On a seasonally adjusted annualized basis, nonresidential spending totaled $982.2 billion for the month, up 16.8% from the previous year.

Multifamily Housing | Mar 24, 2023
Average size of new apartments dropped sharply in 2022
The average size of new apartments in 2022 dropped sharply in 2022, as tracked by RentCafe. Across the U.S., the average new apartment size was 887 sf, down 30 sf from 2021, which was the largest year-over-year decrease.

Multifamily Housing | Mar 14, 2023
Multifamily housing rent rates remain flat in February 2023
Multifamily housing asking rents remained the same for a second straight month in February 2023, at a national average rate of $1,702, according to the new National Multifamily Report from Yardi Matrix. As the economy continues to adjust in the post-pandemic period, year-over-year growth continued its ongoing decline.

Contractors | Mar 14, 2023
The average U.S. contractor has 9.2 months worth of construction work in the pipeline, as of February 2023
Associated Builders and Contractors reported today that its Construction Backlog Indicator increased to 9.2 months in February, according to an ABC member survey conducted Feb. 20 to March 6. The reading is 1.2 months higher than in February 2022.

Industry Research | Mar 9, 2023
Construction labor gap worsens amid more funding for new infrastructure, commercial projects
The U.S. construction industry needs to attract an estimated 546,000 additional workers on top of the normal pace of hiring in 2023 to meet demand for labor, according to a model developed by Associated Builders and Contractors. The construction industry averaged more than 390,000 job openings per month in 2022.

Market Data | Mar 7, 2023
AEC employees are staying with firms that invest in their brand
Hinge Marketing’s latest survey explores workers’ reasons for leaving, and offers strategies to keep them in the fold.

Multifamily Housing | Feb 21, 2023
Multifamily housing investors favoring properties in the Sun Belt
Multifamily housing investors are gravitating toward Sun Belt markets with strong job and population growth, according to new research from Yardi Matrix. Despite a sharp second-half slowdown, last year’s nationwide $187 billion transaction volume was the second-highest annual total ever.


