


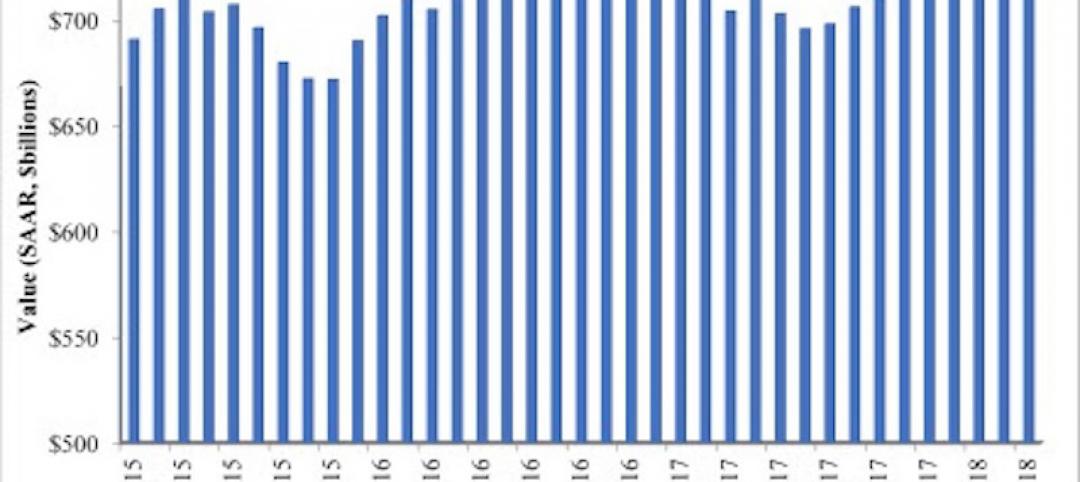
Through April of this year, the national average increase in construction cost was 4.48%, annualized. Construction put in place during April 2019, at a seasonally adjusted annualized rate of $1.299 trillion, was 1.2% below construction put in place in April 2018.
In its just-released second quarter Construction Cost Report for North America, which is based on data from a dozen U.S. markets ansdn two Canadian markets, the construction management consultant Rider Levett Bucknall reiterates the financial and time impacts that the shortage of qualified trade workers is having on the construction industry’s productivity and expansion.
“Even as technology transforms the jobsite, improving both efficiency and worker safety, skilled-labor recruitment and retention are essential to the future of construction,” writes Julian Anderson, FRICS, Rider Levett Bucknall’s President-North America. “As worker shortage makes projects more costly and slower to build, the risk of undermining broader economic growth increases.”
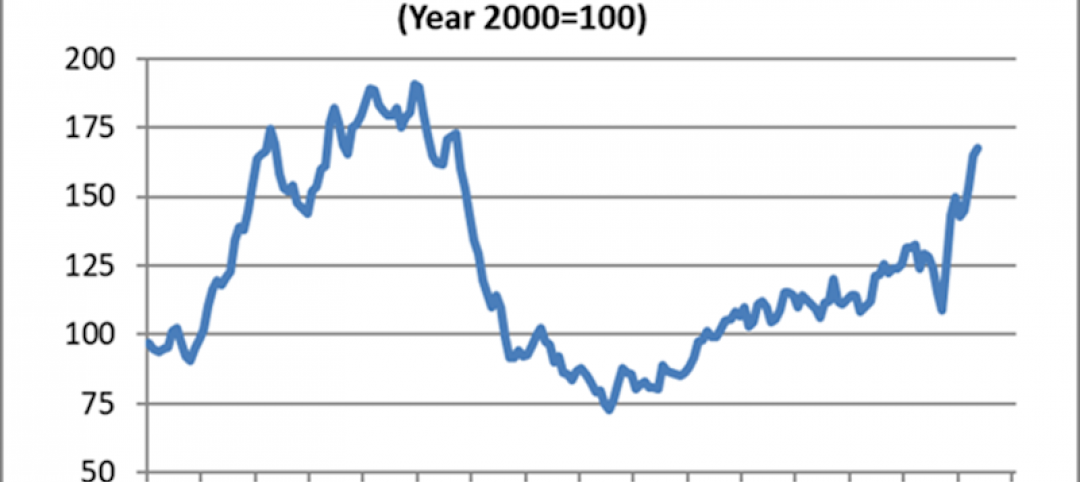
RLB’s National Construction Cost Index stood at 200.55 in the second quarter of 2019, up from 189.8 in the same quarter a year earlier, and 182.16 in Q2 2017. Keep in mind that these increases are occurring at a time when there has been relatively little inflation in the economy.

The construction backlog in North America was more than nine months in the second quarter. Image: Rider Levett Bucknall, from Associated Builders and Contractors estimates.
RLB's estimates are in line Turner Construction's quarterly Building Cost Index (https://bit.ly/2xWrf61), which the GC giant released on July 16. That Index, at 1149, was up 1.23% over the first quarter, and 5.51% over the second quarter of 2018. “Contractors continue to be selective due to the availability of skilled labor,” wrote Attilio Rivetti, Turner's vice president responsible for compiling its cost index.
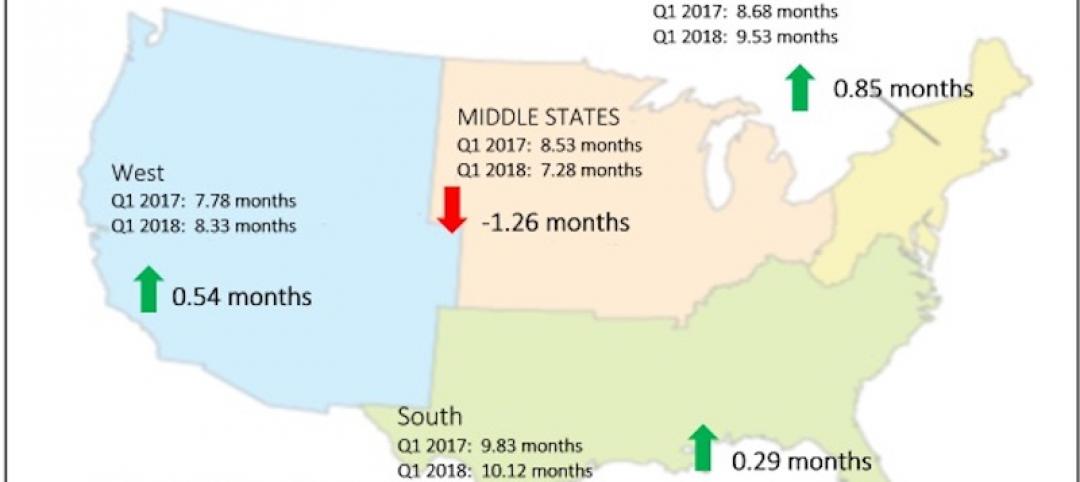
To further make its case, RLB cites the Associated Builders and Contractors’ Construction Backlog Indicator, which reflects the amount of work that will be performed by commercial and industrial contractors in the months ahead. The backlog for 2018 averaged 9.15 months, slightly below the 2017 average but still up 17% from 2011.
The report breaks down current building costs by market and by seven typologies: offices, retail, hotels, hospitals, warehouses, parking, and residential. For example, Las Vegas, Phoenix, Portland, Seattle, and Denver continue to be relative bargains for office construction, based on their costs per sf. Los Angeles, Washington DC, and New York are the high-priced spreads when building hospitals. As for hotel construction, Honolulu and San Francisco are priciest.
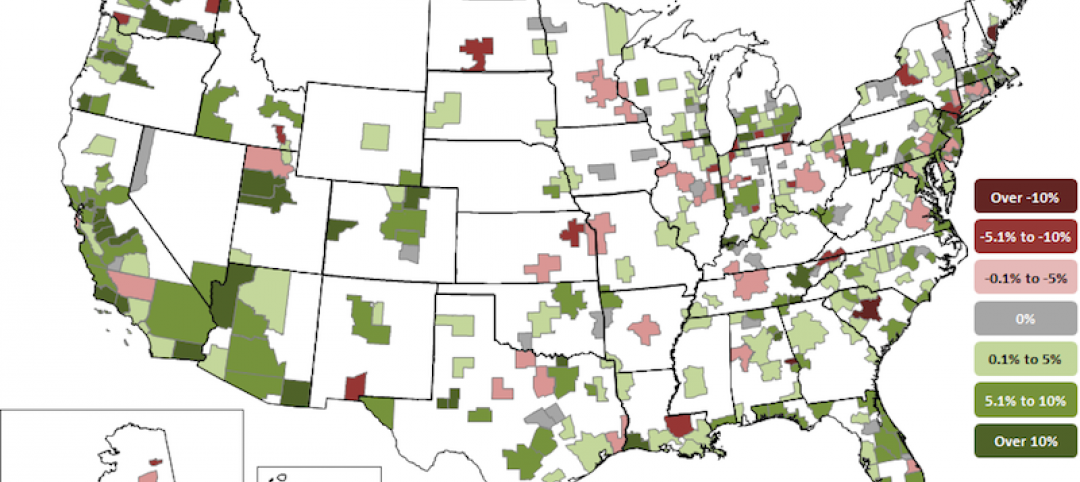
Overall, Chicago experienced the greatest increase in construction bid costs (including materials, labor, and fees), 8.77%, between April 2018 and April 2019, followed San Francisco (7.05%), Portland (6.82%), Seattle (6.68%), Phoenix (6.47%), and Honolulu (5.83%), all above the national average increase.
Los Angeles, while no slouch on the construction front, was the only metro that RLB tracks that experienced a decrease in construction costs in the second quarter, down 1.22%.

Chicago experienced the highest percentage increase in quarterly construction costs. Image: Rider Levett Bucknall
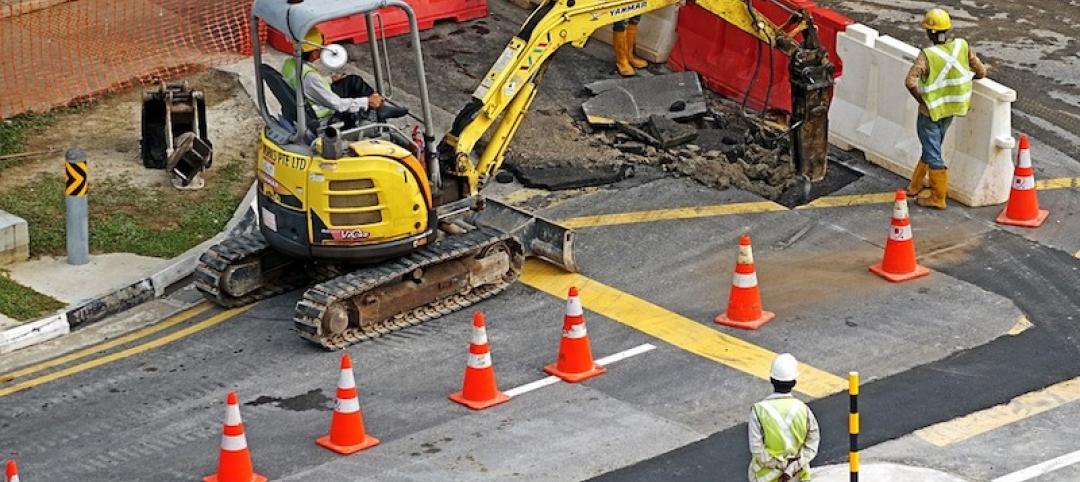
Through the first quarter of 2019, construction unemployment remained steady at 5.2%. The vast majority of construction firms are still having trouble filling open positions. And this situation could worsen, according to the Associated General Contractors of America, as a result of the Trump Administration’s proposal, announced last month, which would exclude the construction sector from the Labor Department’s apprenticeship framework. (Currently, more than three quarters of the federally administered apprenticeships in the U.S. are either in construction or part of military training, notes RLB.)
In a separate report that gauges construction activity by the number of cranes in use in North America, RLB’s July survey marked the fourth consecutive increase. However, only two of 11 U.S. markets tracked—Los Angeles and Denver—saw an increase in cranes. Five other cities were steady.
Cranes for commercial projects were up nationally and accounted for 41% of the cranes in use in New York City. In all markets, mixed-use and multifamily residential construction accounted for 67% of the cranes counted. In Seattle alone, mixed use and residential required 78% of cranes used.
Related Stories
Market Data | Jun 19, 2018
ABC’s Construction Backlog Indicator remains elevated in first quarter of 2018
The CBI shows highlights by region, industry, and company size.
Market Data | Jun 19, 2018
America’s housing market still falls short of providing affordable shelter to many
The latest report from the Joint Center for Housing Studies laments the paucity of subsidies to relieve cost burdens of ownership and renting.

Market Data | Jun 18, 2018
AI is the path to maximum profitability for retail and FMCG firms
Leading retailers including Amazon, Alibaba, Lowe’s and Tesco are developing their own AI solutions for automation, analytics and robotics use cases.

Market Data | Jun 12, 2018
Yardi Matrix report details industrial sector's strength
E-commerce and biopharmaceutical companies seeking space stoke record performances across key indicators.
Market Data | Jun 8, 2018
Dodge Momentum Index inches up in May
May’s gain was the result of a 4.7% increase by the commercial component of the Momentum Index.
Market Data | Jun 4, 2018
Nonresidential construction remains unchanged in April
Private sector spending increased 0.8% on a monthly basis and is up 5.3% from a year ago.
Market Data | May 30, 2018
Construction employment increases in 256 metro areas between April 2017 & 2018
Dallas-Plano-Irving and Midland, Texas experience largest year-over-year gains; St. Louis, Mo.-Ill. and Bloomington, Ill. have biggest annual declines in construction employment amid continuing demand.

Market Data | May 29, 2018
America’s fastest-growing cities: San Antonio, Phoenix lead population growth
San Antonio added 24,208 people between July 2016 and July 2017, according to U.S. Census Bureau data.
Market Data | May 25, 2018
Construction group uses mobile technology to make highway work zones safer
Mobile advertising campaign urges drivers who routinely pass through certain work zones to slow down and be alert as new data shows motorists are more likely to be injured than construction workers.
Market Data | May 23, 2018
Architecture firm billings strengthen in April
Firms report solid growth for seven straight months.


