


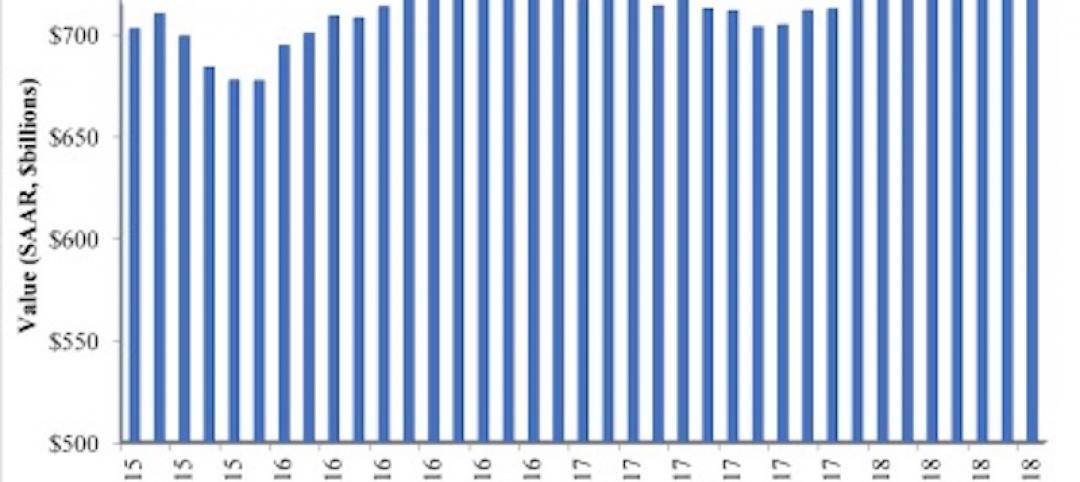
Through April of this year, the national average increase in construction cost was 4.48%, annualized. Construction put in place during April 2019, at a seasonally adjusted annualized rate of $1.299 trillion, was 1.2% below construction put in place in April 2018.
In its just-released second quarter Construction Cost Report for North America, which is based on data from a dozen U.S. markets ansdn two Canadian markets, the construction management consultant Rider Levett Bucknall reiterates the financial and time impacts that the shortage of qualified trade workers is having on the construction industry’s productivity and expansion.
“Even as technology transforms the jobsite, improving both efficiency and worker safety, skilled-labor recruitment and retention are essential to the future of construction,” writes Julian Anderson, FRICS, Rider Levett Bucknall’s President-North America. “As worker shortage makes projects more costly and slower to build, the risk of undermining broader economic growth increases.”
RLB’s National Construction Cost Index stood at 200.55 in the second quarter of 2019, up from 189.8 in the same quarter a year earlier, and 182.16 in Q2 2017. Keep in mind that these increases are occurring at a time when there has been relatively little inflation in the economy.

The construction backlog in North America was more than nine months in the second quarter. Image: Rider Levett Bucknall, from Associated Builders and Contractors estimates.
RLB's estimates are in line Turner Construction's quarterly Building Cost Index (https://bit.ly/2xWrf61), which the GC giant released on July 16. That Index, at 1149, was up 1.23% over the first quarter, and 5.51% over the second quarter of 2018. “Contractors continue to be selective due to the availability of skilled labor,” wrote Attilio Rivetti, Turner's vice president responsible for compiling its cost index.
To further make its case, RLB cites the Associated Builders and Contractors’ Construction Backlog Indicator, which reflects the amount of work that will be performed by commercial and industrial contractors in the months ahead. The backlog for 2018 averaged 9.15 months, slightly below the 2017 average but still up 17% from 2011.
The report breaks down current building costs by market and by seven typologies: offices, retail, hotels, hospitals, warehouses, parking, and residential. For example, Las Vegas, Phoenix, Portland, Seattle, and Denver continue to be relative bargains for office construction, based on their costs per sf. Los Angeles, Washington DC, and New York are the high-priced spreads when building hospitals. As for hotel construction, Honolulu and San Francisco are priciest.
Overall, Chicago experienced the greatest increase in construction bid costs (including materials, labor, and fees), 8.77%, between April 2018 and April 2019, followed San Francisco (7.05%), Portland (6.82%), Seattle (6.68%), Phoenix (6.47%), and Honolulu (5.83%), all above the national average increase.
Los Angeles, while no slouch on the construction front, was the only metro that RLB tracks that experienced a decrease in construction costs in the second quarter, down 1.22%.

Chicago experienced the highest percentage increase in quarterly construction costs. Image: Rider Levett Bucknall
Through the first quarter of 2019, construction unemployment remained steady at 5.2%. The vast majority of construction firms are still having trouble filling open positions. And this situation could worsen, according to the Associated General Contractors of America, as a result of the Trump Administration’s proposal, announced last month, which would exclude the construction sector from the Labor Department’s apprenticeship framework. (Currently, more than three quarters of the federally administered apprenticeships in the U.S. are either in construction or part of military training, notes RLB.)
In a separate report that gauges construction activity by the number of cranes in use in North America, RLB’s July survey marked the fourth consecutive increase. However, only two of 11 U.S. markets tracked—Los Angeles and Denver—saw an increase in cranes. Five other cities were steady.
Cranes for commercial projects were up nationally and accounted for 41% of the cranes in use in New York City. In all markets, mixed-use and multifamily residential construction accounted for 67% of the cranes counted. In Seattle alone, mixed use and residential required 78% of cranes used.
Related Stories
Market Data | Sep 17, 2018
ABC’s Construction Backlog Indicator hits a new high in second quarter of 2018
Backlog is up 12.2% from the first quarter and 14% compared to the same time last year.

Market Data | Sep 12, 2018
Construction material prices fall in August
Softwood lumber prices plummeted 9.6% in August yet are up 5% on a yearly basis (down from a 19.5% increase year-over-year in July).
Market Data | Sep 7, 2018
Safety risks in commercial construction industry exacerbated by workforce shortages
The report revealed 88% of contractors expect to feel at least a moderate impact from the workforce shortages in the next three years.
Market Data | Sep 5, 2018
Public nonresidential construction up in July
Private nonresidential spending fell 1% in July, while public nonresidential spending expanded 0.7%.

Market Data | Aug 30, 2018
Construction in ASEAN region to grow by over 6% annually over next five years
Although there are disparities in the pace of growth in construction output among the ASEAN member states, the region’s construction industry as a whole will grow by 6.1% on an annual average basis in the next five years.
Market Data | Aug 22, 2018
July architecture firm billings remain positive despite growth slowing
Architecture firms located in the South remain especially strong.

Market Data | Aug 15, 2018
National asking rents for office space rise again
The rise in rental rates marks the 21st consecutive quarterly increase.

Market Data | Aug 13, 2018
First Half 2018 commercial and multifamily construction starts show mixed performance across top metropolitan areas
Gains reported in five of the top ten markets.
Market Data | Aug 10, 2018
Construction material prices inch down in July
Nonresidential construction input prices increased fell 0.3% in July but are up 9.6% year over year.

Market Data | Aug 9, 2018
Projections reveal nonresidential construction spending to grow
AIA releases latest Consensus Construction Forecast.


