

This month, the national average hourly construction wage was expected to top $30 for the first time in the country’s history. And in its Q3 2016 Construction Outlook, JLL forecasts another 3% increase by next March.
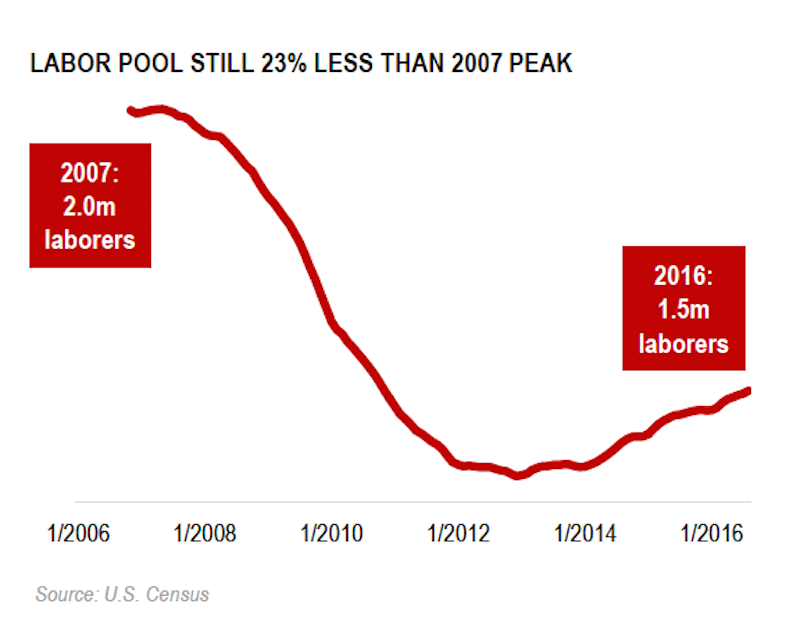
That prediction comes at a time when the number of construction workers at the end of the third quarter of 2016—1.46 million—was up 2.8% compared to the same period a year earlier. “The size of the labor pool is rebounding from the downturn, but at a much slower rate than demand,” JLL reports. Consequently, poaching labor from competing contractors and bid jumping have increased in several markets.
Labor-intensive industries, such as drywall and roofing, can expect to experience continued cost growth as a result of manpower shortages.
What’s happening on the labor scene is one of three factors that JLL identifies as having the greatest impact on U.S. construction currently.
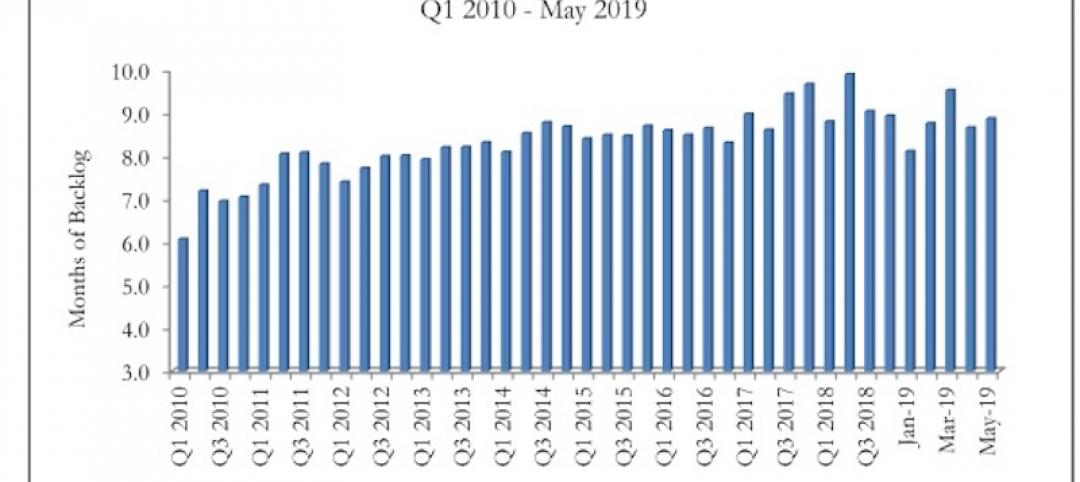
In the third quarter, $317 billion was spent on construction, up 1% from the same quarter in 2015. The national construction backlog was 8.5 months, flat from a year ago. And while the pipeline in many sectors remains strong across property types, JLL cautions that demand is “normalizing” in many markets. “We can expect to see a national slowdown in the construction industry by end-of-year 2017 and with it, a shift in how clients are using construction services.”
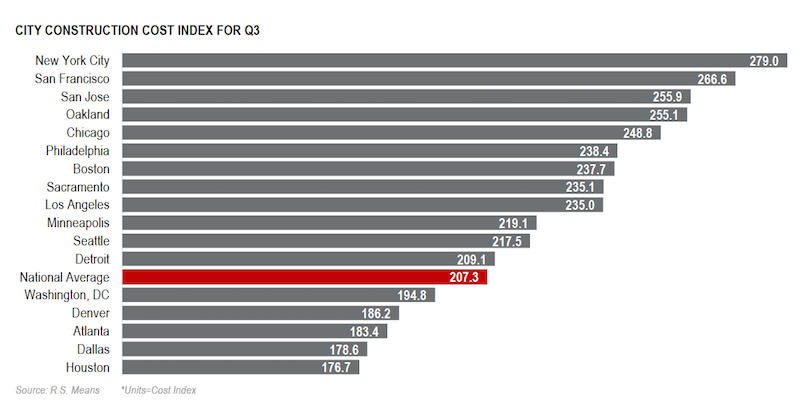 Increases in labor and materials are driving construction costs, especially in coastal metros where activity is particularly robust. Image: JLL Q3 2016 Construction Outlook.
Already, banks have become more selective in their lending practices, financing standards continue to tighten, and securing loans for construction is tougher. JLL also expects uncertainty over the next several months pending policy decisions of the new president, Donald Trump, who has stated publicly that investment in infrastructure will be a key focus.
JLL, though, isn’t so sure:
“By end-of-year 2017, expect to see a softer construction industry across the U.S., as demand and market saturations begin to level out across property types. A significant decline isn’t expected, but the rate of growth in the industry will slow, spurring greater competition between firms seeking work.”
Material costs rose 2.2% in the quarter, compared to 2015, as lumber consumption in the U.S. rose 10%. JLL doesn't expect the lumber trend to reverse until 2018 and 2019. Whereas, steel prices, which remain low, will continue to decline through the year few years, while cement prices, which have been declining slightly this year, will level off in 2017.
The Construction Outlook finds that early adopters of technology are better positioned competitively for what could be coming next. Technology that includes BIM, drones, and 3D scanners “is having a profound impact on how project managers, contractors and service firms do their jobs through software, hardware, and the sharing economy.”
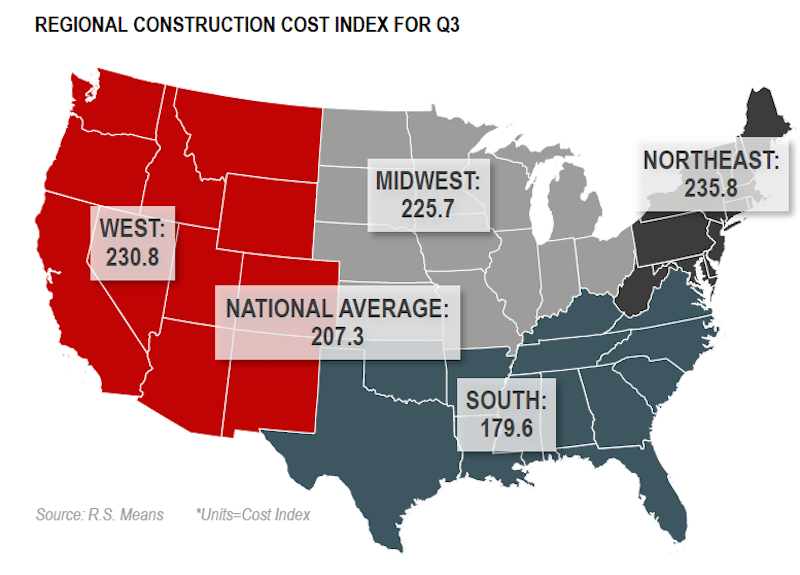 The Midwest region maintains an upward trajectory,but trails the West by two months. Southern construction markets are steadily growing and will continue to grow over the next three quarters. Image: JLL Q3 2016 Construction Outlook
The Outlook examined building activity in a number of sectors:
•At the end of the third quarter, 105.4 million sf of office space was under construction, up from 100.6 million sf in the same quarter a year ago. However, starts and completions were down.
•The pipeline for industrial construction rose 5.8% to 204.3 million sf, and quarterly absorptions jumped 32.3% over the second quarter.
•Acquisitions continue to drive growth in the hospitality sector, as transaction volume in the third quarter, $10.5 billion, was nearly double Q2 2016. However, while lodging occupancy still hovers at historic highs, it was down slightly in the third quarter, to 66.9%.
•82.4 million sf of retail space was under construction in the third quarter, more than 45% of which in the Southeast. But the retail sector remains volatile, after several recent announcements of store closings by high-profile chains like Office Depot/Office Max, which shuttered 400 outlets).
Related Stories

Market Data | Jul 20, 2019
Construction costs continued to rise in second quarter
Labor availability is a big factor in that inflation, according to Rider Levett Bucknall report.
Market Data | Jul 18, 2019
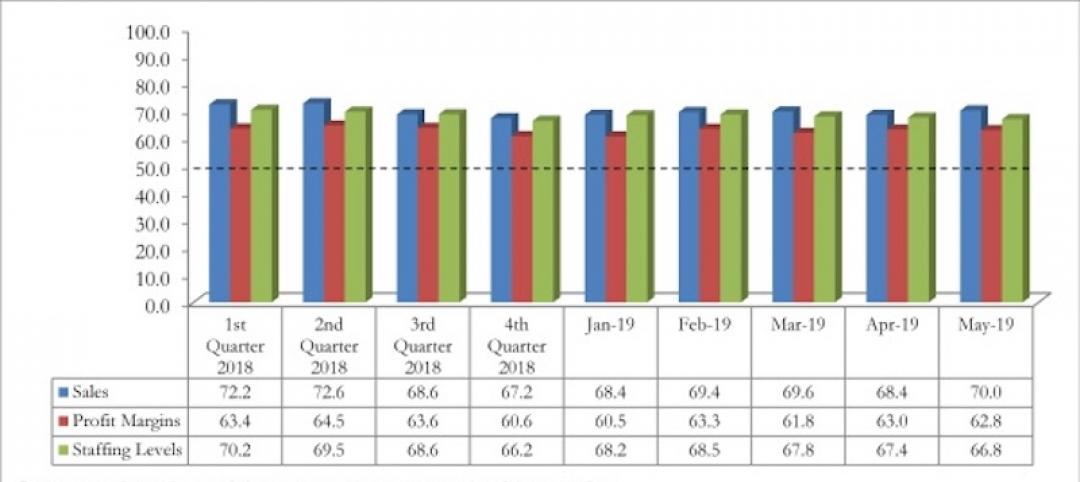
Construction contractors remain confident as summer begins
Contractors were slightly less upbeat regarding profit margins and staffing levels compared to April.
Market Data | Jul 17, 2019
Design services demand stalled in June
Project inquiry gains hit a 10-year low.
Market Data | Jul 16, 2019
ABC’s Construction Backlog Indicator increases modestly in May
The Construction Backlog Indicator expanded to 8.9 months in May 2019.

K-12 Schools | Jul 15, 2019
Summer assignments: 2019 K-12 school construction costs
Using RSMeans data from Gordian, here are the most recent costs per square foot for K-12 school buildings in 10 cities across the U.S.
Market Data | Jul 12, 2019
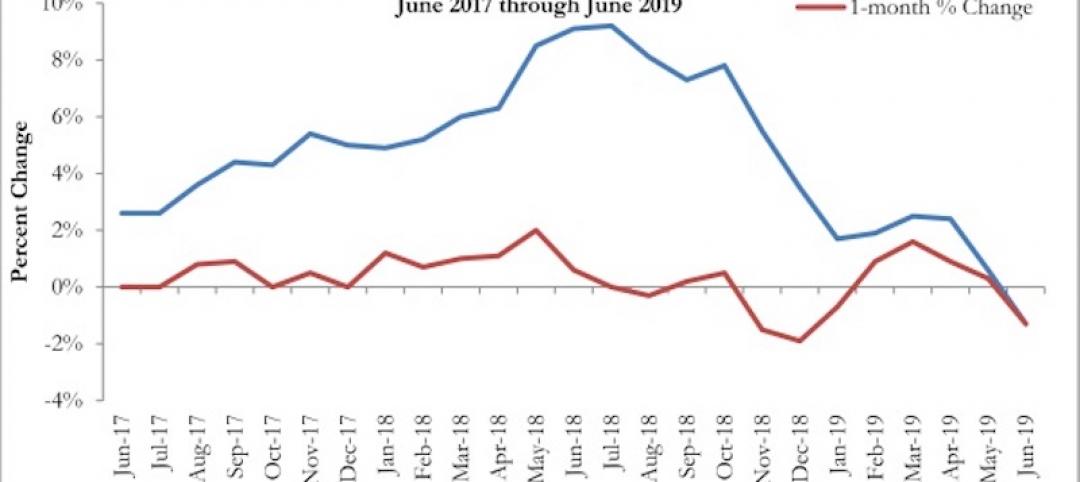
Construction input prices plummet in June
This is the first time in nearly three years that input prices have fallen on a year-over-year basis.
Market Data | Jul 1, 2019
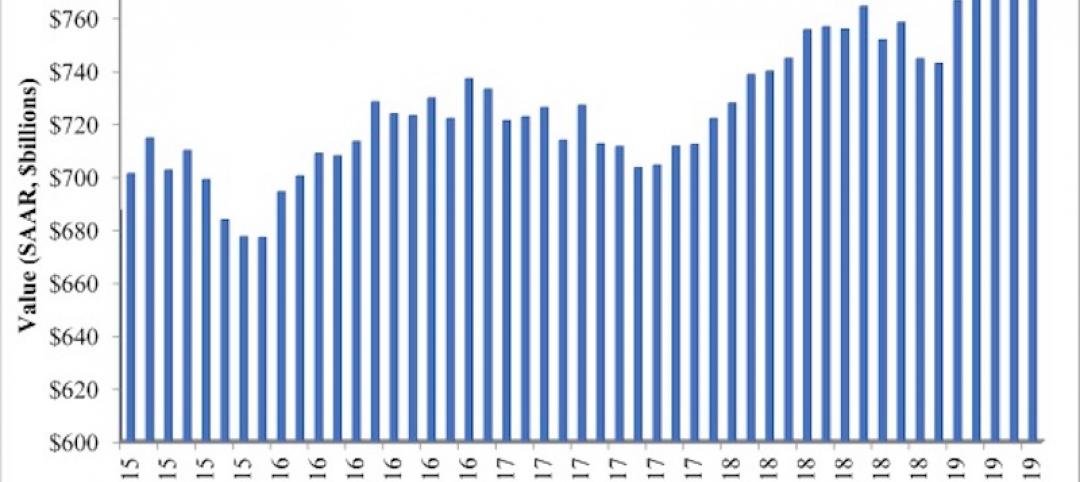
Nonresidential construction spending slips modestly in May
Among the 16 nonresidential construction spending categories tracked by the Census Bureau, five experienced increases in monthly spending.

Market Data | Jul 1, 2019
Almost 60% of the U.S. construction project pipeline value is concentrated in 10 major states
With a total of 1,302 projects worth $524.6 billion, California has both the largest number and value of projects in the U.S. construction project pipeline.
Market Data | Jun 21, 2019
Architecture billings remain flat
AIA’s Architecture Billings Index (ABI) score for May showed a small increase in design services at 50.2.

Market Data | Jun 19, 2019
Number of U.S. architects continues to rise
New data from NCARB reveals that the number of architects continues to increase.


