

The city that never sleeps and the city of broad shoulders might be getting a bit tired and atrophied, respectively. Chicago and New York, two of the three biggest cities in the country, are also at the top of the list for cities people are bailing on like a ship taking on water.
As Annie Radecki, senior manager at John Burns Real Estate Consulting, reports, U-Haul moving truck price disparities can indicate where people are moving before anything more official comes along, and these price disparities don’t look good for many Midwest and Northeast cities.
The idea behind using U-Haul price disparities makes sense; the more people there are moving to a particular city the more trucks there will eventually be in that city. Thus, the price will go down to rent a truck from that city and take it somewhere else. The reverse is also true.
For example, on average, it costs $2,455 to drive a truck to Portland, Ore., from one of the other 15 cities John Burns Consulting analyzed. However, it only costs $952 to drive a truck from Portland. That is a 61% difference.
Getting back to New York and Chicago, it costs 119% more to rent a truck and drive it from New York than to it, and 101% more to do the same with Chicago.
All of this points to the fact that places like New York, Chicago, Philadelphia (86% more expensive), and Boston (83% more expensive) are bleeding like stuck pigs.
You may be asking yourself, where are these former Midwest and Northeast residents headed? The answer is to open waters in the South and the Northwest, where the cost of living is more affordable.
Portland may be at the top of the list, but Seattle, Phoenix, Atlanta, and Austin rank in at 53%, 47%, 42%, and 38% less expensive to rent a U-Haul from, as well.
While city living might be growing in its appeal, the appeal of these high-cost, mature cities seems to be waning while newer cities with better job markets and lower costs are growing in popularity.
Related Stories

Market Data | Dec 11, 2017
Global hotel construction pipeline is growing
The Total Pipeline stands at 12,427 Projects/2,084,940 Rooms.
Market Data | Dec 11, 2017
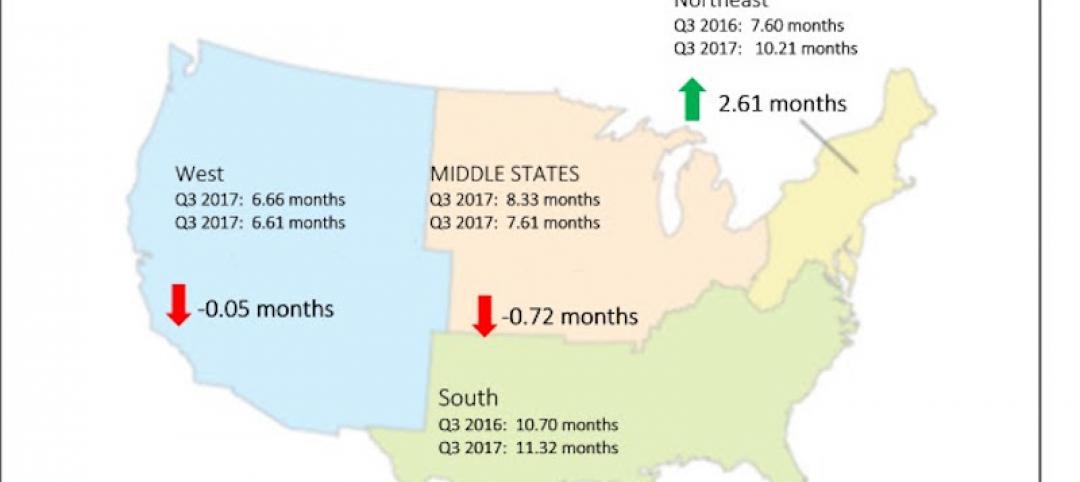
Construction backlog surges, sets record in third quarter
CBI is a leading economic indicator that reflects the amount of construction work under contract, but not yet completed.
Market Data | Dec 7, 2017
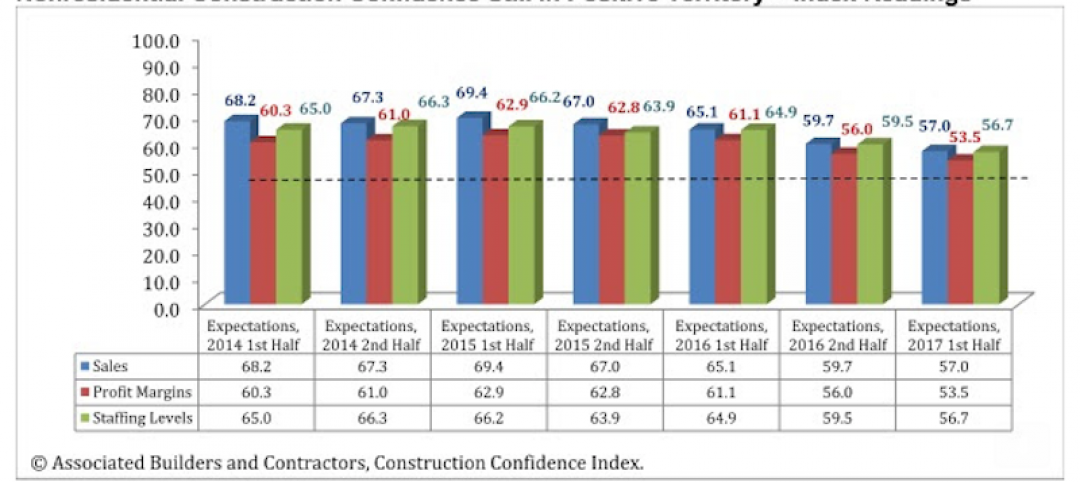
Buoyed by healthy economy, ABC Index finds contractors upbeat
Despite rising construction labor and materials costs, 55% of contractors expect their profit margins to expand in the first half of 2018.

Industry Research | Nov 28, 2017
2018 outlook: Economists point to slowdown, AEC professionals say ‘no way’
Multifamily housing and senior living developments head the list of the hottest sectors heading into 2018, according a survey of 356 AEC professionals.

Architects | Nov 28, 2017
Adding value through integrated technology requires a human touch
To help strike that delicate balance between the human and the high-tech, we must first have an in-depth understanding of our client’s needs as well as a manufacturer’s capabilities.
Market Data | Nov 27, 2017
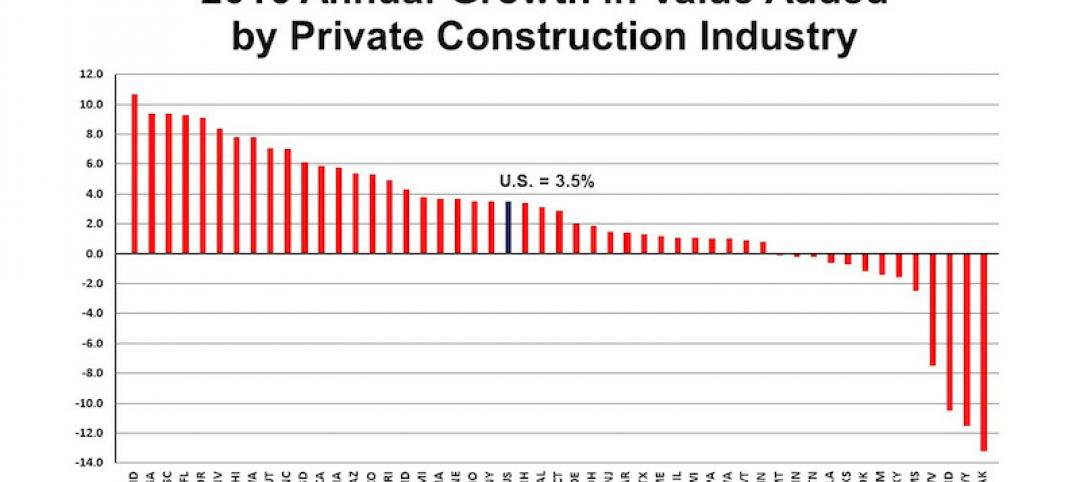
Construction's contribution to U.S. economy highest in seven years
Thirty-seven states benefited from the rise in construction activity in their state, while 13 states experienced a reduction in activity.

Market Data | Nov 15, 2017
Architecture Billings bounce back
Business conditions remain uneven across regions.

Market Data | Nov 14, 2017
U.S. construction starts had three consecutive quarters of positive growth in 2017
ConstructConnect’s quarterly report shows the most significant annual growth in the civil engineering and residential sectors.

Market Data | Nov 3, 2017
New construction starts in 2018 to increase 3% to $765 billion: Dodge report
Dodge Outlook Report predicts deceleration but still growth, reflecting a mixed pattern by project type.
Market Data | Nov 2, 2017
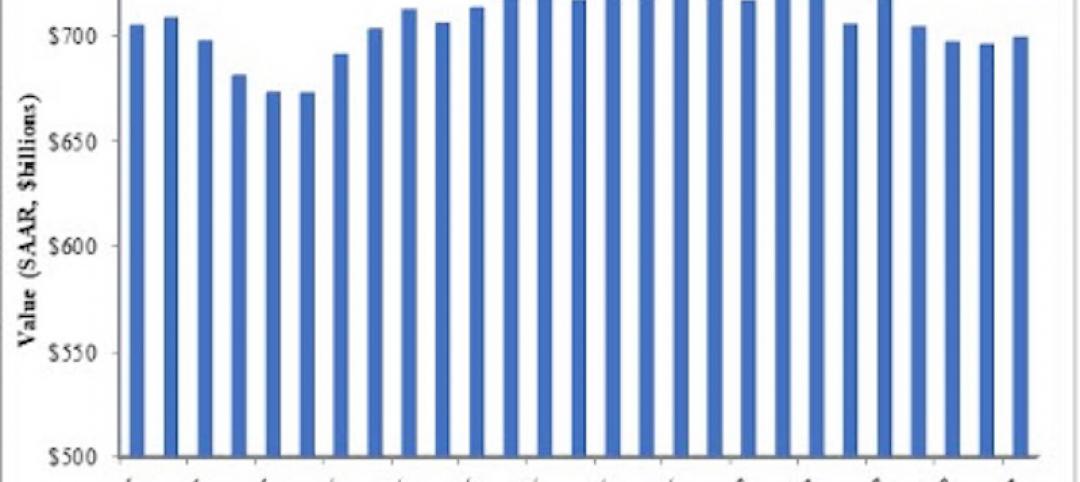
Construction spending up in September; Down on a YOY basis
Nonresidential construction spending is down 2.9% on a year-over-year basis.


