

: BIM data without models")
Over the last several years, owners have begun to grasp that BIM can deliver more than just 3D models and better trade coordination. As a result, many organizations now require BIM data deliverables intended for downstream operations, and have developed transfer standards for embedding data in models during design. The vision is that owners can then use these data-rich models to retrieve that information at a future date for day-to-day tasks, like work order management and equipment maintenance.
But this approach fails to address important challenges, including cumbersome file sizes and the need to preserve the integrity of facility data as 3D software evolves and changes.
Fortunately, there are emerging tools and standards where raw data can occupy the center of an owner’s operational information. These new data visualization tools address several shortcomings of embedding data, and transform an owner’s ability to consume BIM data, without model geometry, but still with the ability to see that data in some context.
Problems with Embedding data
Embedding data directly in models presents three key obstacles: slower performance, data interoperability, and data archiving.
• The challenge of slower performance is due to the presence of 3D geometry, which requires a lot of computer processing power and special hardware. Embedding data in 3D models means that to retrieve the embedded data, the viewer has to navigate the "heavy" geometry context, even though the data itself is relatively "light." This is a barrier to easy consumption of data.
• The second challenge—data interoperability—is the difficulty posed by shuttling data between software packages, and to have that data transfer successfully. Frequently, building data is retrieved from BIM and then uploaded to a CMMS system to manage operations tasks. But these exchanges often result in data "drops" where valuable information does not transfer, and is lost--forever. Facility data is too valuable to be dropped in these casual ways.
• This leads to the third, and an often overlooked, challenge facing owners: data archiving, the ability to preserve important data and to have it live for decades, not just a few software versions. This important goal is often compromised when software products are discontinued, and retrieving the data at a future date requires the discontinued software. Only a new "data-centric" solution can truly put the appropriate focus on data.
New Tools offer Solutions
At the risk of oversimplifying, the fundamental problem facing facility owners comes down to managing two items: a) equipment components and b) the spaces those components reside in. The key attraction of embedding data in BIM is that it helps put equipment data in context; rather than having product data in external spreadsheets and tables, BIM allows component data to be seen in its context - in BIM’s case, a spatial context.
But there are emerging new ways to create engaging context with data, i.e. pure data, just text, no geometry, no CAD, no drawings, just data. New data visualization tools, like Power BI and Tableau, handle large datasets and can interrelate them and make them richly interactive visually by simply linking properties between tables. Power BI and Tableau are two common products in a new generation of data analysis tools that vastly simplify and enrich the tasks of aggregating and visualizing large datasets, and are growing in popularity with design teams.
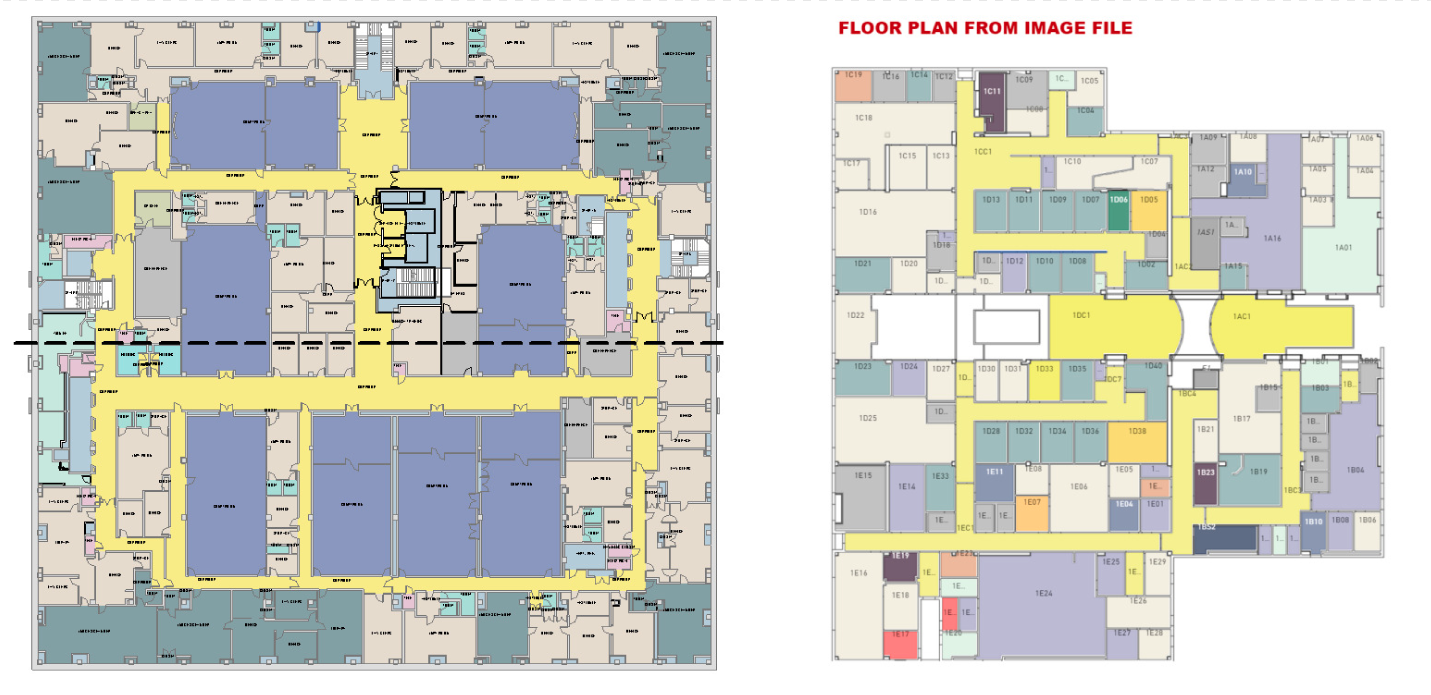 Data visualizations can emulate floor plans from BIM. The image above shows a floor plan from Revit (left) next to a custom plan visual in Power BI.
Much of what owners are trying to track about each component is about two things—where it is, and what it is. ‘Where it is’ often means identifying the space, the floor, the zone and the building a component resides in; ‘what it is’ includes the model, the manufacturer, the spare part, and a host of other equipment data. These aspects are often available in simple text data form from catalogs and equipment schedules. With new tools this text data can be easily enriched and extended to include all this space and location data—but to keep it in the form of pure data.
COBie and Data Harvesting
So what might ‘pure data’ for buildings look like for owners? Think COBie (Construction to Operations Building Information Exchange) [link to WBDG.ORG]. The COBie format has been around for over a decade and is a very efficient format to describe and locate building components. At its heart it is a defined set of tables listing building components, spaces, floor levels, and other aspects of a project contained in a spreadsheet. These tables address the issues of ‘where’ things are, and ‘what’ things are.
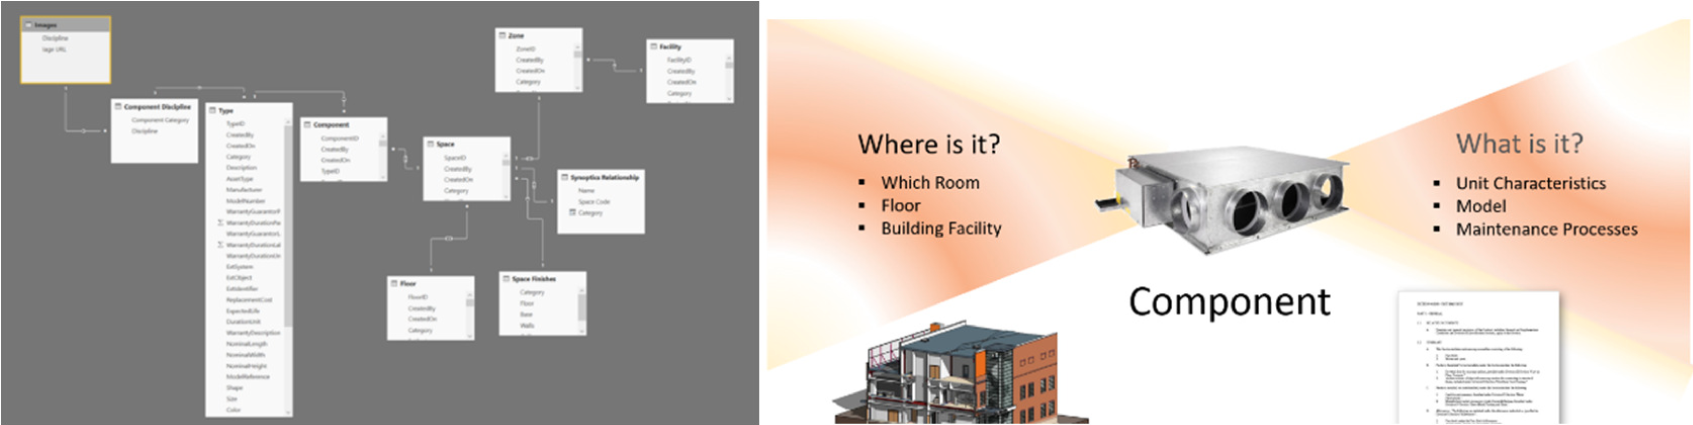 COBie is a series of data tables linked together to create rich interactive data viewing.
When the tables are related—that is, certain fields are interconnected—and the new visual tools are used, the data becomes much more meaningful and interactive. Clicking on a room in one list for example, allows all the components for that room in another table to be isolated. This is how context is created in the pure data approach, by relating tables of spaces, floor levels, systems and components properties, context is created with relational databases.
While COBie is currently delivered as an export from a BIM file, it is possible to imagine an approach where data forms the originating basis of a building’s data structure, where it could then be linked into a model rather than be extracted. Pure data in tabular form has the advantage that it can be pushed to a variety of end uses (of which BIM is just one), and without the data loss that can occur when data is embedded in tools that are really suited to 3D.
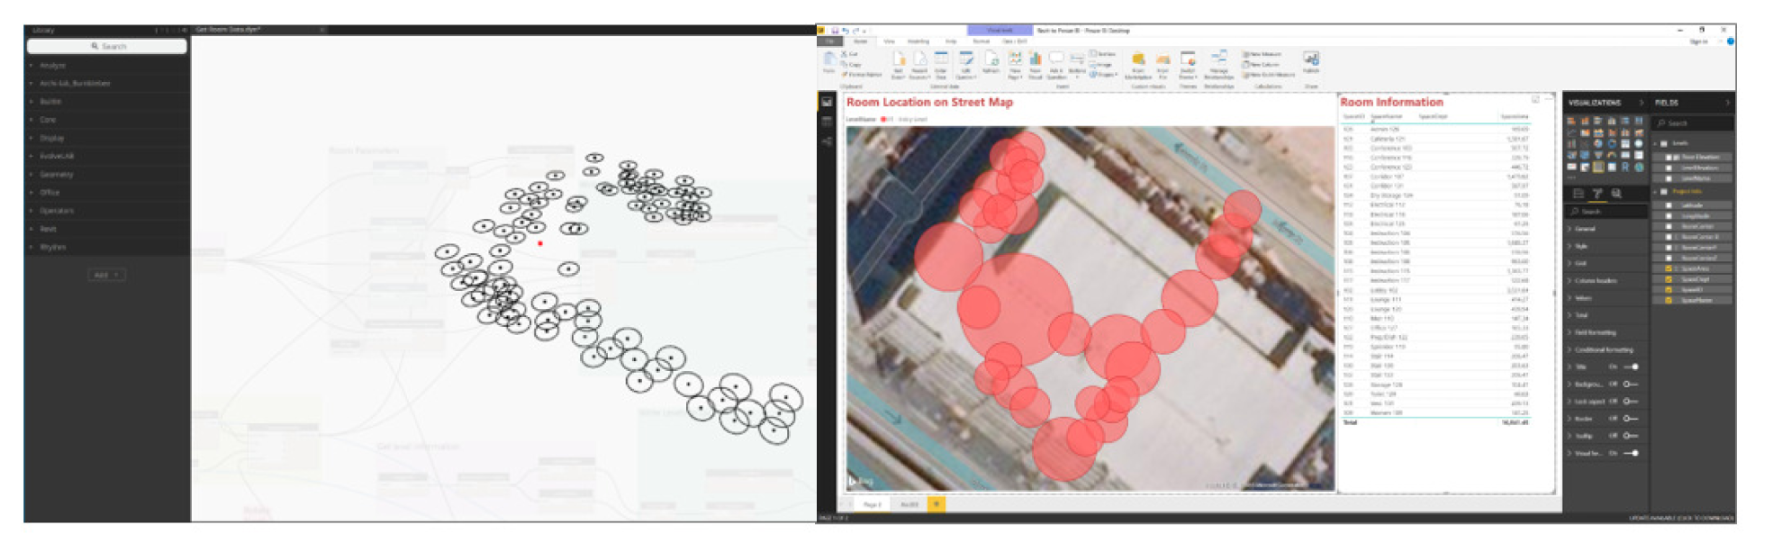 Using Dynamo, rooms were culled from the Revit model and then geo-located in a Power BI file. Clicking on the room activated all the information about those rooms in the tables.
One additional development is greatly expanding the power of data management with BIM—that is a growing ability to harvest deeply-buried data from BIM files with new scripting tools like Dynamo (above) and Python. With these new harvesting techniques, designers can access previously elusive model properties and can extract a host of useful BIM data as tabular lists. This expanded data harvesting, combined with the new visualization capabilities, represent a significant acceleration in the growth of pure data for facilities.
BI(m) - Data at the Center
None of this focus on pure data contradicts the desire that data should be available in 3D models; there are several use-cases where data embedded in BIM models can be highly effective. But given the long-term issues of interoperability and archiving for the end user, the future of BIM data will likely look more like BI(m)—that is BIM data, but living outside the model. In ‘BI(m)’, the uppercase “BI’ acknowledges the primary goal of BIM as Building Information, but the small ‘m’ signifies the reduced importance of the model after construction is complete. With a BI(m) approach, data would be referenced into models rather than embedded; the difference is whether the data lives in the component, or is available to it from a central source.

So what we’re really talking about here is: where should the center be? If building data resides within 3D software, that software is often unwieldy and prone to obsolescence, and once the 3D software is retired, it can be impossible to open the source file, and retrieve the data. But if the model instead receives data from a stable pure data source, then it solves a host of thorny issues and still allows the data to be queried for many years.
Owners have a new opportunity to redefine how they want building data to be delivered by design teams for Operations. Spreadsheet-based data previously required a dedicated team of data scientists to structure, analyze and present it in a meaningful way. But as we have seen, newer data analysis technologies have vastly enriched and simplified the experience of browsing pure tabular data. It is now possible to generate numerous interactive visuals with pure data to uncover context and insights. Consequently, for those interested in advancing BIM and facilities management to the next generation, the future will likely involve leveraging new tools for the new power of data—pure data.
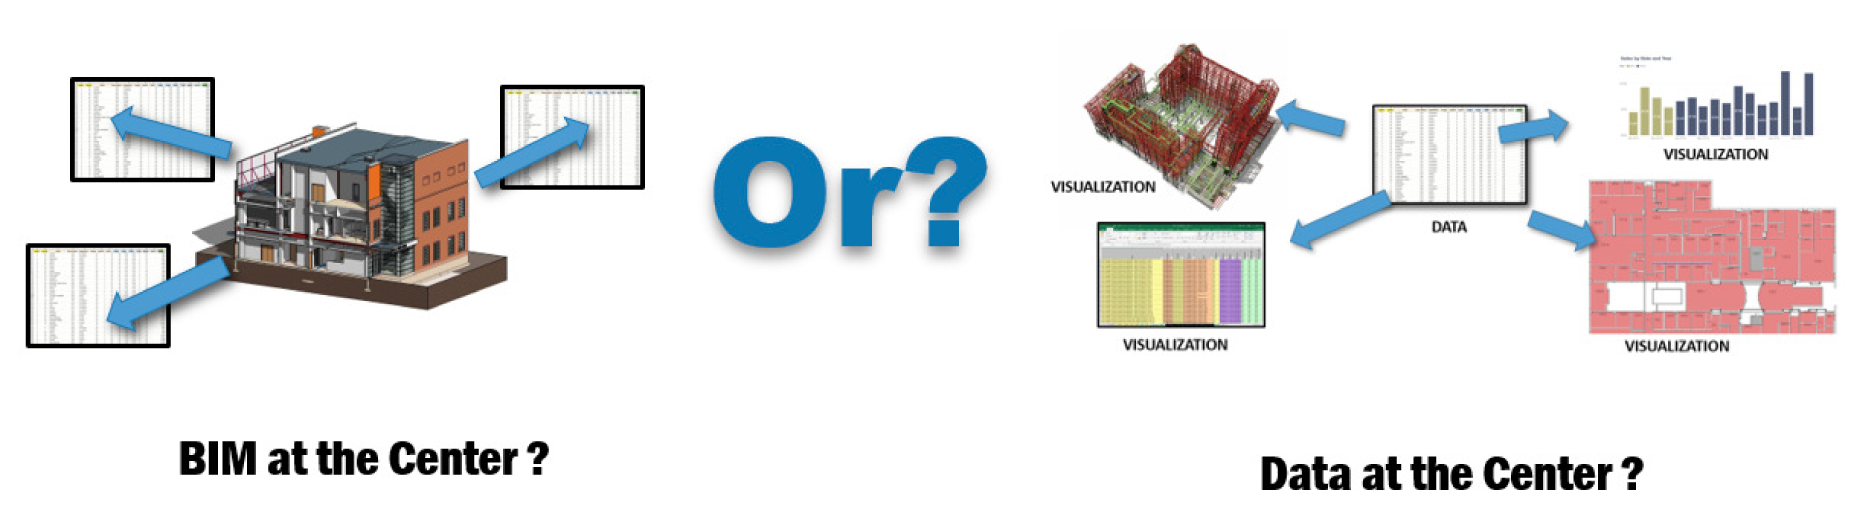 The fundamental question BI(m) asks is “What is at the center of a building database, BIM or Data?”
About the Author
John Tobin is the Albany, N.Y., Office Director for SMRT Architects and Engineers, headquartered in Portland, Maine. He has spent three decades spearheading new practice technologies, especially BIM and advanced delivery, and then as an AE technology and operations leader. Most recently, Tobin has begun integrating new data analysis techniques with BIM processes.
Related Stories
| Jun 13, 2017
Accelerate Live! talk: Scaling change in a changing industry, Chris Mayer, Suffolk Construction
Suffolk’s CIO Chris Mayer talks about the firm’s framework for vetting and implementing new technologies and processes.
| Jun 13, 2017
Accelerate Live! talk: Gaming tech in construction, Lucas Richmond, Gilbane
Learn why Gilbane’s Lucas Richmond is looking outside the AEC industry to build his rockstar gaming and media team.
| Jun 12, 2017
Accelerate Live! talk: The world's smartest buildings, Derik Eckhardt, Miller Hull Partnership
Discover what architect Derik Eckhardt learned during his worldwide tour of the globe’s smartest buildings, from Abu Dhabi to Amsterdam to Stuttgart to Dubai.
| Jun 12, 2017
Accelerate Live! talk: Preparing for the AI revolution, Alan Robles, Gensler
Gensler’s Alan Robles shares how the AEC Giant firm is preparing its project teams and clients for the coming artificial intelligence movement.
| May 24, 2017
Accelerate Live! talk: Applying machine learning to building design, Daniel Davis, WeWork
Daniel Davis offers a glimpse into the world at WeWork, and how his team is rethinking workplace design with the help of machine learning tools.
| May 24, 2017
Accelerate Live! talk: Learning from Silicon Valley - Using SaaS to automate AEC, Sean Parham, Aditazz
Sean Parham shares how Aditazz is shaking up the traditional design and construction approaches by applying lessons from the tech world.
| May 24, 2017
Accelerate Live! talk: The data-driven future for AEC, Nathan Miller, Proving Ground
In this 15-minute talk at BD+C’s Accelerate Live! (May 11, 2017, Chicago), Nathan Miller presents his vision of a data-driven future for the business of design.

AEC Tech | May 23, 2017
A funny thing may happen on the way to AI
As AI proves safe, big business will want to reduce overhead.

AEC Tech | May 11, 2017
Accelerate Live!: Social media reactions from BD+C's AEC innovation conference
BD+C's inaugural Accelerate Live! innovation conference took place May 11, in Chicago.

AEC Tech | Feb 16, 2017
Positioning computational designers in your business: 4 things to consider
There appears to be very little industry consensus as to what a ‘computational design’ position actually means in a business setting.


