


This article is part of BD+C's special five-part Technology Report 2014: Top tech tools and trends for AEC professionals.
Gregory Janks feels a bit like an impostor at his firm. A self-proclaimed “numbers geek” with a PhD in mathematics and degrees in science and economic science, Janks relies on a much different process for developing and vetting planning and design strategies than the tried-and-true approaches utilized by many of his peers at Sasaki Associates (www.sasaki.com).
His rigorous, data-driven methods have opened the eyes of many at the design table, and have helped the firm’s clients—primarily higher education and healthcare institutions—tackle some excruciatingly difficult capital planning questions, most notably: What should we build next? And where?
“There’s a facilities arms race happening in higher education and other sectors, where the feeling is, ‘More is better,’” says Janks, Principal and Director of Sasaki Strategies, a group formed in 2005 to bring a strong analytical function to the firm’s planning and design work. “What we’re trying to promote is more isn’t necessarily better; better is better. We’re using a more objective, somewhat scientific approach to help our clients indentify the projects that will add the most value. Instead of asking, ‘What do you think you need?,’ we’re able to help them prioritize their needs.”
Data analytics, for example, helped the Sasaki team make a strong case to Brown University leaders that the school’s plan to move its engineering department off campus to an innovation district nearby would be detrimental, both financially and strategically, to the Ivy League institution.
4 ways Building Teams benefit from data-driven design
1. Enhance iterative design. Designers are able to capture and analyze key building performance metrics, such as energy use intensity, during conceptual design. That information can then be used to tweak and optimize early prototypes.2. Use project data on future work. By collecting data on every project, design firms can eliminate rework and apply best practices on future projects.
3. Understand how people interect with spaces. Firms can test and evaluate design concepts against the real world, using feedback data from building occupants.
4. Automate the planning process. Some firms are applying algorithm-based approaches to improve the traditional project planning process.
The firm came to this conclusion after analyzing numerous datasets—from course enrollment numbers to faculty collaboration patterns to university financial data—and then creating a series of network visualizations to help “tell the story” to school officials, says Janks. Data collection methods included custom mobile surveys to faculty and real-time, crowdsourced feedback on how students and faculty use the campus via Sasaki’s Web-based interactive mapping program, MyCampus.
“The results were dramatic,” he says. “For example, it showed that there’s a wonderful intermixing of how students behave in course enrollment, including engineering. It’s inseparable. You can’t pull this core network out without greatly affecting the students, faculty collaboration, and ultimately research dollars. The data helped us convince them to go in another direction.”
Make way for the rise of data-driven design
Janks may be in the minority at his firm, but he’s among a growing number of data analysis and software programming experts to make their way into the AEC field in recent years. A number of BIM and technology consultancies have popped up, as well, to meet the growing demand for data expertise.
Firms like CASE Design Inc. (http://case-inc.com) and Terabuild (www.terabuild.com) are making their living at the intersection where data meets design. Others, like San Bruno, Calif.-based Aditazz (www.aditazz.com), were built from the ground up as data-centric design and planning firms. It’s Silicon Valley meets the AEC field.
“Using data in the AEC industry is not new. The built environment has long been an abundant source of data,” says Randy Deutsch, AIA, LEED AP, Associate Professor in the School of Architecture at the University of Illinois at Urbana-Champaign. “What is new is the amount of data that is available to us, our capacity to measure and ability to capture, process, and act on that data, and, frankly, our industry’s urgent need to do so.”
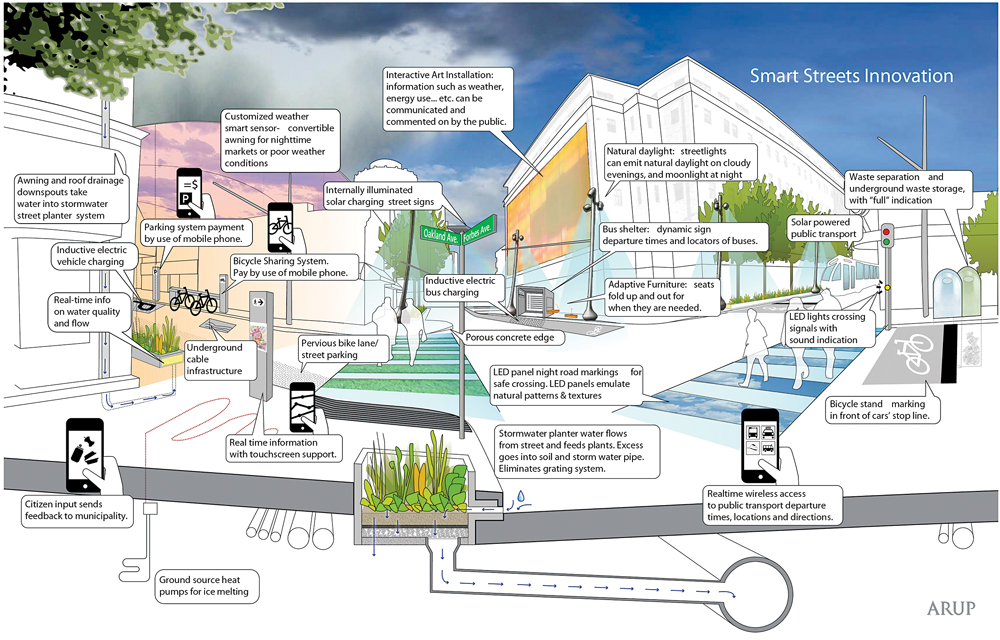
Arup used a variety of data collection methods, including mobile surveys, security camera footage, and traffic flow reports, to better unify two neighborhoods in Pittsburgh: North Side and Oakland. The resulting scheme incorporates improved wayfinding, public artwork, open spaces, and interactive components like real-time public transportation and weather information and pay-by-phone bike sharing.
Deutsch, who is currently writing a book on Big Data applications for the AEC field, says the data boom represents an opportunity to completely transform how firms design, construct, and operate buildings. But getting there means they must overcome some significant barriers, namely interoperability, reliability of the data, privacy, and security. There’s also the trust factor. Data-driven design, for instance, may require the client to open its books or allow greater access to its employees or end users for feedback.
“The use of Big Data in decision making in design involves securing a commitment within teams and the organization, reinventing internal and external processes, and modifying organizational behavior,” says Deutsch. “The AEC industry is among the last to address these challenges. We need to catch up, and quickly.”
Lessons from early data-driven application
There are literally hundreds of applications for deep analytics in planning and design projects, not to mention the many benefits for construction teams, building owners, and facility managers. For the purposes of this report, we’re focusing on data-driven design and planning applications only. Here are some early successful applications, according to the experts interviewed for this report:
Enhance iterative design. By condensing the feedback loop on conceptual design schemes from days (or even weeks) to just hours, design teams can tweak and optimize early prototypes based on the simulated performance and characteristics of the design. Software providers like Sefaira and Autodesk offer off-the-self solutions for on-the-fly energy modeling (see page 34), but some firms are taking the iterative design process to new levels with customized solutions.
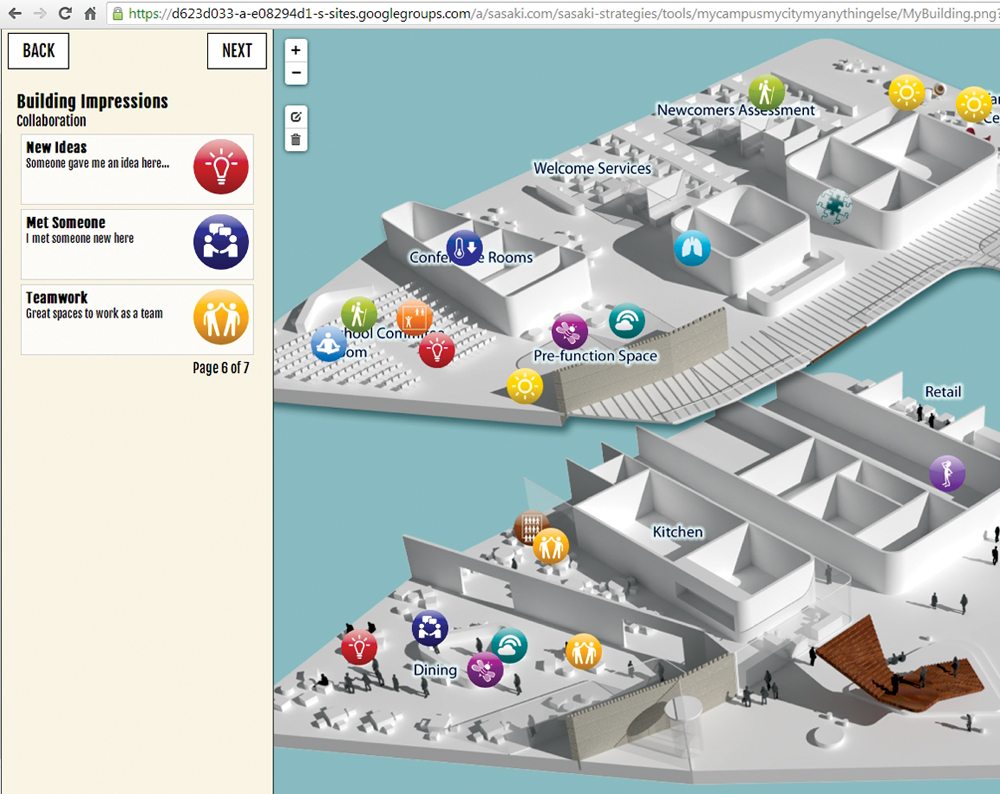
Sasaki Associates is among a number of design firms to develop custom survey and interactive mapping tools to better understand how building occupants and end users interact with the built environment. Using the firm’s MyCampus and MyBuilding (pictured) mapping tools, Sasaki designers are able to collect real-time information on everything from where people hang out on campus to what they like most and least about a building.
The Chicago office of RTKL recently commissioned CASE Design to develop a software program that captures dozens of key project metrics—including total building area, floor area ratio, area based on project program requirements, percent of green space on the site, percent of green roof area, and façade area—straight from the 3D conceptual design programs RTKL’s designers regularly use (SketchUp and Rhino). The program will even run a solar analysis of early conceptual designs, providing feedback on shading requirements and daylighting performance. The early stage design data is fed automatically into an Excel document and shared with the client and design team in real time using charts and dashboards.
“Instead of using building information as a capture of the final design, it’s fed back into the early design process to help the team make decisions that will ideally lead to a better building downstream,” says Nathan Miller, Associate Partner and Director of Architecture and Engineering Solutions with CASE. “The program automates what typically is a manual process—capturing building information from conceptual models—which allows the team to adjust and tweak the design on the fly.”
Capture project data for future use. The data feedback loop extends beyond the project, as well. Firms like Skidmore, Owings & Merrill are creating databases of past project information and geometries for use on future work. If a particular design component worked well on a project, the firm will be able to share that information for use on other designs. This approach also minimizes rework, allowing designers to focus their time on solving new challenges.
Understand how people interact with spaces. Design teams are tapping into a host of data sources—from Twitter feeds to mobile surveys to security camera footage—to observe how people use and move through spaces. Often, they discover that design intent does not match reality.
“In theory, using the formulas and benchmarks that most standard building programming exercises depend on, you’ll be able to predict exactly what people need,” says Sasaki’s Janks. “But when we test designs against the real world, we find that often there is zero relationship between the two.”
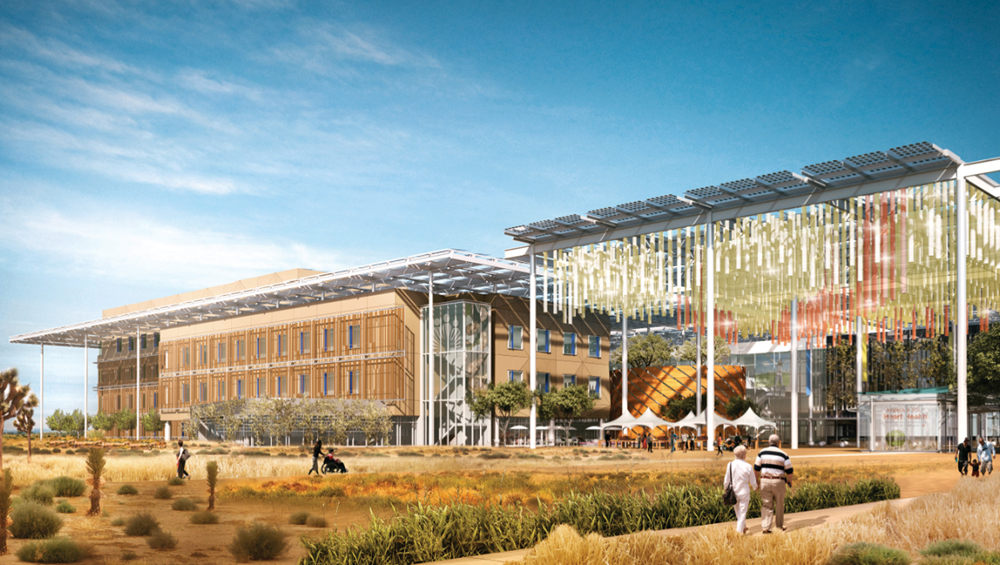
Silicon Valley startup Aditazz used a largely algorithm-based process to develop its winning design scheme for Kaiser Permanente’s Small Hospital, Big Idea competition (the firm tied for first place). By supplementing tried-and-true design and planning methods with computer-driven processes, the firm was able to quickly develop and test thousands of design schemes to find the best solution.
Janks offers a dramatic example: During the initial planning stages for a renovation project at Harvard University’s John F. Kennedy School of Government, the Sasaki team used its MyCampus interactive mapping program to poll the students, faculty, and staff on what they liked and didn’t like about the campus. They also tracked their movement throughout the spaces. Among the findings: hardly anyone entered the building through the front door.
How Big Data will improve urban planning
Last November, Arup and the Royal Institute of British Architects released a joint report, Designing with Data: Shaping our Future Cities, which explores the many potential uses and benefits of Big Data analytics in an urban environment. The report highlights four key applications:1. Designing for people. By collecting real-time data (via social media, mobile surveys, video cameras, sensors, etc.) on how people use public spaces and infrastructure, design teams and cities will have a better understanding of user needs and can create spaces that better meet those needs.
2. Experimentation. Data and modeling tools could allow designers and planners to save time and potentially money by testing designs before they enter the construction process. This could also help identify likely objections and model solutions, saving time in the planning process.
3. Improve policy implementation. Cities have the potential to use the vast amounts of data they hold to improve the planning and delivery of services to citizens, by using the data to identify and address urban problems.
4. Transparency. By making more data publicly available, cities and governments can make it easier for designers and planners to get critical information on development sites faster.
“The map showed this torrent of people coming in through the back door, and absolutely nobody going through the front door,” says Janks. “It’s the kind of thing that previously we’d argue back and forth with the client about. But when we showed them the map, the entire conversation changed instantly. As a result, the campus plan was completely reorganized to what was the back side of the building.”
Automate the planning process. Could a computer one day replace a human planning team? Not likely. But it could take on a large portion of the traditional design planning tasks on projects, according to Deepak Aatresh, Founder of Silicon Valley planning and design startup Aditazz.
An entrepreneur with a background in silicon chip design and manufacturing, Aatresh is bringing his analytical approach for designing, testing, and building microchips to the healthcare design world. The firm, which launched in 2009, applies a series of algorithm-based processes, virtual simulations, and other digital planning tools to design healthcare facilities based on the hundreds of programmatic and operations inputs from the client, as well as outside factors such as building code requirements and green standards.
The goal is to develop the optimal design solution as quickly as possible by relying on computers to do what humans can’t: perform millions of complex calculations in fractions of a second. For instance, by applying automatic space-planning tools on projects, Aditazz designers can test thousands of iterations of building configurations and layouts in seconds.
The firm’s process kicks out thousands of design options based on client input, and then quickly narrows the list down to a few ideal solutions. Aatresh argues that as much as 80% of the typical decision making that goes into creating a healthcare facility—from building orientation and space layout to patient wait times and traffic flow—can be handled through computation.
Aditazz surprised many in the architectural community in March 2012, when its largely algorithm-driven design scheme tied for first place in Kaiser Permanente’s Small Hospital, Big Idea competition, beating out more than 100 entrants. The firm has gone on to win numerous commissions for healthcare work, most recently a cancer hospital project at Shantou University Medical College in Guangdong, China.
The data-driven future
Our report highlights just a few potential applications for data-driven design. Many more uses will be discovered, our experts argue, when the industry reaches a tipping point where the majority of project stakeholders—from AEC firms to building owners to government agencies—get serious about analytics for the design and planning of building projects.
Related Stories
| Aug 11, 2010
Architectural Visualization Rendering the Future
Three-dimensional design tools have revolutionized the way architects and engineers design buildings; in recent years, parametric modeling has enabled Building Teams to impart weight tolerances and other intelligent information to a finished design. Yet many designers say they use 3D most in the conceptual design stage, when detailed building information is not necessary and can actually encumb...
| Aug 11, 2010
Big-time BIM
As the need for new state, county, and municipal facilities keeps growing and funding for public building construction continues to shrink, state and local officials are left with two basic options: renovate dilapidated older buildings and hope for the best, or build new facilities on anemic budgets.
| Aug 11, 2010
Dotting the I in IPD
Collaboration software is going beyond just sharing files. It is being used to enable full building information modeling early in design. Two programs are enabling Building Teams to more easily share the information in BIM and use it for integrated project delivery: Bluebeam Software, which just released the newest version of its AEC-specific PDF collaboration tool; and eBuilder Enterprise, a W...
| Aug 11, 2010
Great Solutions: Business Management
22. Commercial Properties Repositioned for University USE Tocci Building Companies is finding success in repositioning commercial properties for university use, and it expects the trend to continue. The firm's Capital Cove project in Providence, R.I., for instance, was originally designed by Elkus Manfredi (with design continued by HDS Architects) to be a mixed-use complex with private, market-...
| Aug 11, 2010
BIM adoption tops 80% among the nation's largest AEC firms, according to BD+C's Giants 300 survey
The nation's largest architecture, engineering, and construction companies are on the BIM bandwagon in a big way, according to Building Design+Construction's premier Top 50 BIM Adopters ranking, published as part of the 2009 Giants 300 survey. Of the 320 AEC firms that participated in Giants survey, 83% report having at least one BIM seat license in house, half have more than 30 seats, and near...
| Aug 11, 2010
Thrown For a Loop in China
While the Bird's Nest and Water Cube captured all the TV coverage during the Beijing Olympics in August, the Rem Koolhaas-designed CCTV Headquarters in Beijing—known as the “Drunken Towers” or “Big Shorts,” for its unusual shape—is certain to steal the show when it opens next year.
| Aug 11, 2010
Great Solutions: BIM/Information Technology
4. Architectural Visualization through Gaming Technology Before 3D walkthroughs for client presentations were popular, HKS manager of Advanced Technologies Pat Carmichael and his team were working to marry gaming engines with 3D building models. "What's being tasked to us more and more is not just to show design, but to show function," Carmichael said.
| Aug 11, 2010
Great Solutions: Collaboration
9. HOK Takes Videoconferencing to A New Level with its Advanced Collaboration Rooms To help foster collaboration among its 2,212 employees while cutting travel time, expenses, and carbon emissions traveling between its 24 office locations, HOK is fitting out its major offices with prototype videoconferencing rooms that are like no other in the U.
| Aug 11, 2010
BIM school, green school: California's newest high-performance school
Nestled deep in the Napa Valley, the city of American Canyon is one of a number of new communities in Northern California that have experienced tremendous growth in the last five years. Located 42 miles northeast of San Francisco, American Canyon had a population of just over 9,000 in 2000; by 2008, that figure stood at 15,276, with 28% of the population under age 18.


