

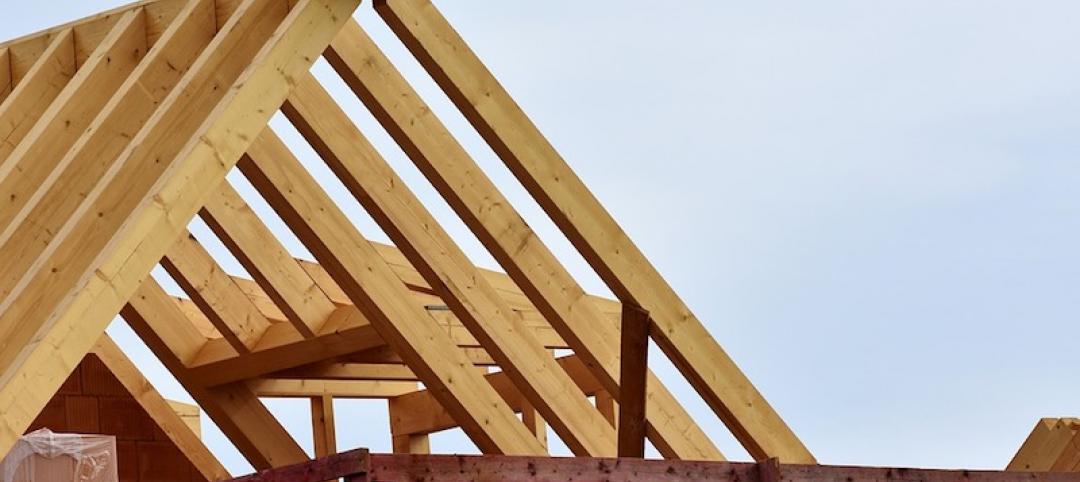
Architecture firm billings growth softened in December but remained positive for the fifteenth consecutive month, according to a new report released today from The American Institute of Architects (AIA).
AIA’s Architecture Billings Index (ABI) score for December was 50.4 compared to 54.7 in November. Despite the positive billings, a softening in growth was seen across several regions and sectors, as well as in project inquiries and design contracts.
“Given the concerns over the ongoing tariff situation, it is not surprising to see a bit of a slowdown in progress on current projects,” said AIA Chief Economist Kermit Baker, PhD, Hon. AIA. “Growing anxiety over unstable business conditions and the partial shutdown of the government may lead to further softening in the coming months.”
Key ABI highlights for December include:
- Regional averages: Midwest (56.3), Northeast (51.6), South (49.4), West (49.2)
- Sector index breakdown: institutional (53.1), commercial/industrial (51.2), mixed practice (50.2), multi-family residential (49.8)
- Project inquiries index: 55.6
- Design contracts index: 52.1
Regional and sector categories above are calculated as a three-month moving average, whereas the national index, design contracts, and inquiries are monthly numbers.
More information on AIA’s ABI is available online.
Related Stories

Market Data | May 29, 2018
America’s fastest-growing cities: San Antonio, Phoenix lead population growth
San Antonio added 24,208 people between July 2016 and July 2017, according to U.S. Census Bureau data.
Market Data | May 25, 2018
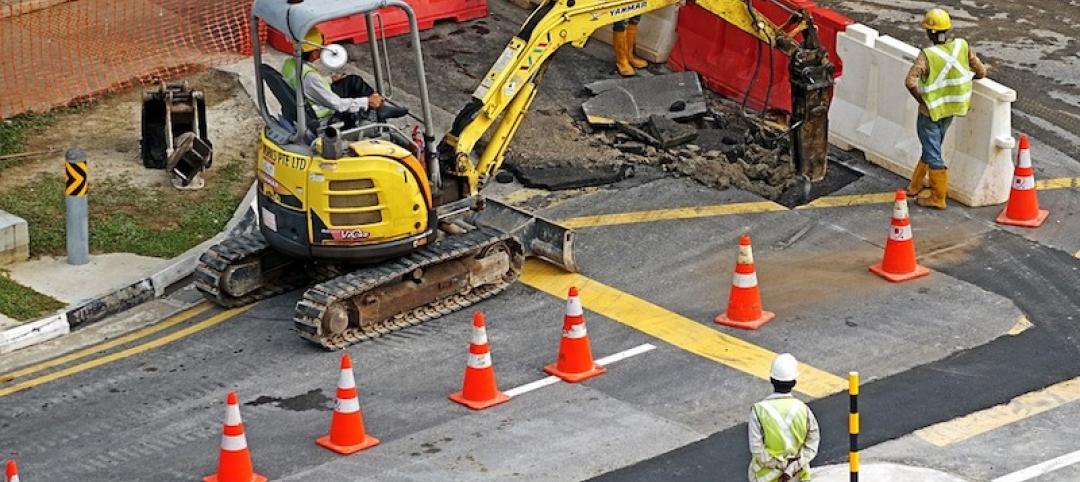
Construction group uses mobile technology to make highway work zones safer
Mobile advertising campaign urges drivers who routinely pass through certain work zones to slow down and be alert as new data shows motorists are more likely to be injured than construction workers.

Market Data | May 23, 2018
Architecture firm billings strengthen in April
Firms report solid growth for seven straight months.
Market Data | May 22, 2018
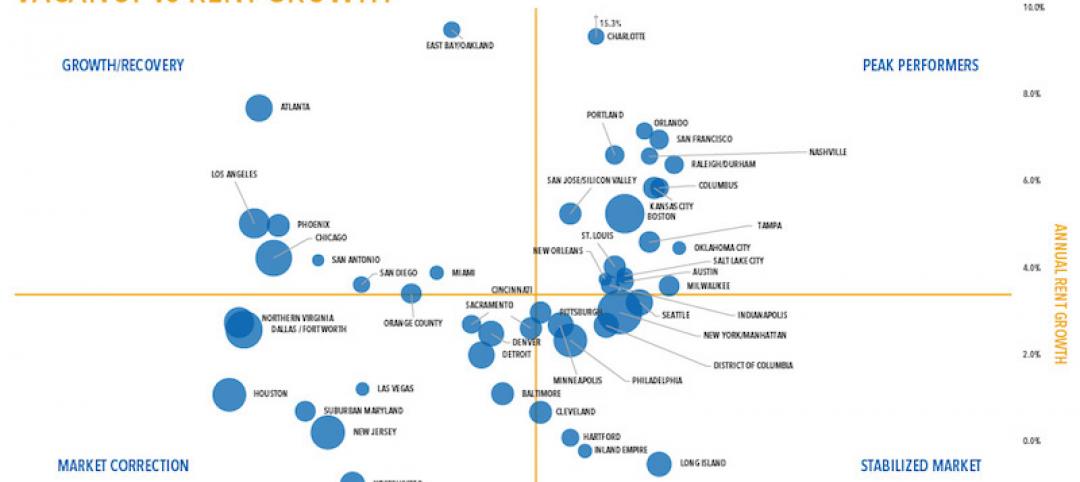
Vacancies stable, rents rising, and pipeline receding, according to Transwestern’s 1Q US Office Market report
The Big Apple still leads the new construction charge.
Market Data | May 18, 2018
Construction employment rises in 38 states and D.C. from April 2017 to April 2018
California & West Virginia have biggest annual job gains, North Dakota has largest decline; California & Louisiana have largest monthly pickup, Indiana & North Dakota lead monthly drops.

High-rise Construction | May 18, 2018
The 100 tallest buildings ever conventionally demolished
The list comes from a recent CTBUH study.

Resiliency | May 17, 2018
Architects brief lawmakers and policy-makers on disaster recovery as hurricane season approaches
Urge senate passage of disaster recovery reform act; Relationship-building with local communities.

Market Data | May 17, 2018
These 25 cities have the highest urban infill development potential
The results stem from a COMMERCIALCafé study.
Market Data | May 10, 2018
Construction costs surge in April as new tariffs and other trade measures lead to significant increases in materials prices
Association officials warn that the new tariffs and resulting price spikes have the potential to undermine benefits of tax and regulatory reform, urge administration to reconsider.

Market Data | May 7, 2018
Construction employers add 17,000 jobs in April and 257,000 for the year
Unemployment rate for construction increases slightly compared to year earlier as higher pay levels appears to be attracting people with recent construction experience back into the workforce.


