


For the fifteenth consecutive month architecture firms reported increasing demand for design services in April, according to a new report today from The American Institute of Architects (AIA).
AIA’s Architecture Billings Index score for April was 56.5 compared to 58.0 in March. Any score above 50 indicates an increase in billings. During April, scores for both new project inquiries and design contracts moderated slightly, but remained strong, posting scores of 62.3 and 55.4, respectively.
“While business conditions at architecture firms have been very encouraging over the past year, project activity has been steadily shifting toward work on existing buildings,” said AIA Chief Economist, Kermit Baker, Hon. AIA, PhD. “Billings for reconstruction projects exceeded those for new construction for the first time in the last two decades. While the reconstruction share of building activity will continue to ebb and flow, in general, we’ll continue to move toward an increased share of building activity for reconstruction and a decreased share for new construction.”
Key ABI Highlights for April Include:
- Regional averages: West (58.2); Midwest (57.6); South (57.3); Northeast (53.1)
- Sector index breakdown: mixed practice (61.2); commercial/industrial (60.7); multi-family residential (57.2); institutional (51.8)
The regional and sector categories are calculated as a three-month moving average, whereas the national index, design contracts and inquiries are monthly numbers.
To learn more about recent economic developments impacting design and construction, visit AIA’s website.
Related Stories
Market Data | Jan 3, 2022
Construction spending in November increases from October and year ago
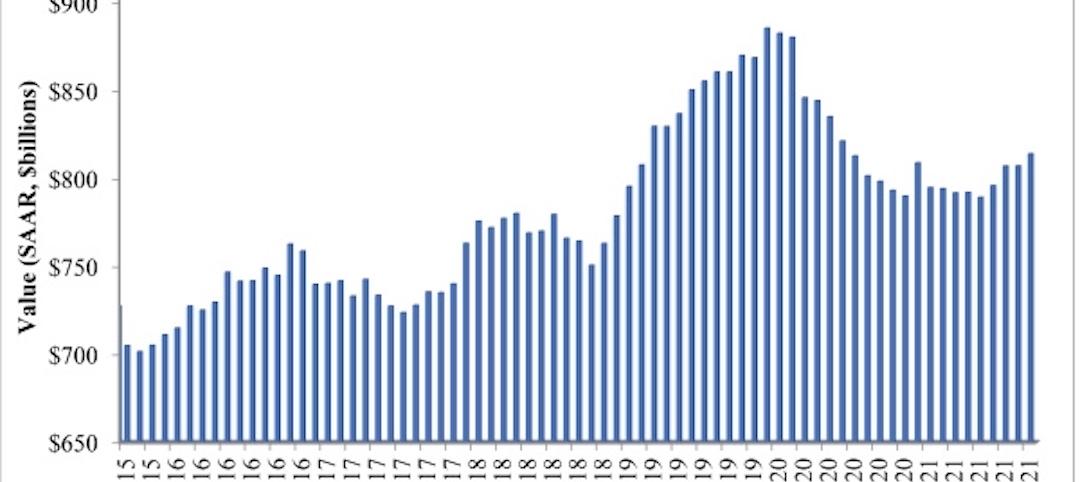
Construction spending in November totaled $1.63 trillion at a seasonally adjusted annual rate.

Market Data | Dec 22, 2021
Two out of three metro areas add construction jobs from November 2020 to November 2021
Construction employment increased in 237 or 66% of 358 metro areas over the last 12 months.
Market Data | Dec 17, 2021
Construction jobs exceed pre-pandemic level in 18 states and D.C.
Firms struggle to find qualified workers to keep up with demand.
Market Data | Dec 15, 2021
Widespread steep increases in materials costs in November outrun prices for construction projects
Construction officials say efforts to address supply chain challenges have been insufficient.

Market Data | Dec 15, 2021
Demand for design services continues to grow
Changing conditions could be on the horizon.
Market Data | Dec 5, 2021
Construction adds 31,000 jobs in November
Gains were in all segments, but the industry will need even more workers as demand accelerates.
Market Data | Dec 5, 2021
Construction spending rebounds in October
Growth in most public and private nonresidential types is offsetting the decline in residential work.
Market Data | Dec 5, 2021
Nonresidential construction spending increases nearly 1% in October
Spending was up on a monthly basis in 13 of the 16 nonresidential subcategories.
Market Data | Nov 30, 2021
Two-thirds of metro areas add construction jobs from October 2020 to October 2021
The pandemic and supply chain woes may limit gains.

Market Data | Nov 22, 2021
Only 16 states and D.C. added construction jobs since the pandemic began
Texas, Wyoming have worst job losses since February 2020, while Utah, South Dakota add the most.


