

There were a few occasions where demand for design services decreased from a month-to-month basis in 2015, but the Architecture Billings Index (ABI) concluded the year in positive terrain and was so in eight of the 12 months of the year.
The American Institute of Architects (AIA) reported the December ABI score was 50.9, up from the mark of 49.3 in the previous month. This score reflects a slight increase in design services (any score above 50 indicates an increase in billings). The new projects inquiry index was 60.2, up from a reading of 58.6 the previous month.
As a leading economic indicator of construction activity, the ABI reflects the approximate nine to twelve month lead time between architecture billings and construction spending.
“As has been the case for the past several years, there continues to be a mix of business conditions that architecture firms are experiencing,” said AIA Chief Economist Kermit Baker, Hon. AIA, PhD. “Overall, however, ABI scores for 2015 averaged just below the strong showing in 2014, which points to another healthy year for construction this year.”
Key December ABI highlights:
- Regional averages: West (53.7), South (53.3), Northeast (46.7), Midwest (46.1),
- Sector index breakdown: multi-family residential (52.9), institutional (52.2), commercial / industrial (47.3), mixed practice (46.5)
- Project inquiries index: 60.2
- Design contracts index: 51.0
The regional and sector categories are calculated as a 3-month moving average, whereas the national index, design contracts and inquiries are monthly numbers.
Related Stories

Market Data | Nov 6, 2018
Unflagging national office market enjoys economic tailwinds
Stable vacancy helped push asking rents 4% higher in third quarter.
Market Data | Nov 2, 2018
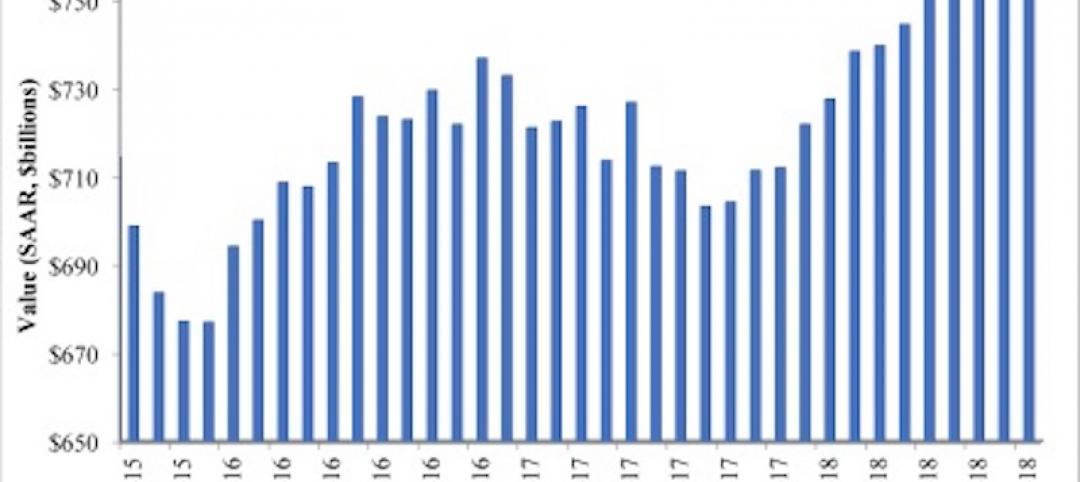
Nonresidential spending retains momentum in September, up 8.9% year over year
Total nonresidential spending stood at $767.1 billion on a seasonally adjusted, annualized rate in September.

Market Data | Oct 30, 2018
Construction projects planned and ongoing by world’s megacities valued at $4.2trn
The report states that Dubai tops the list with total project values amounting to US$374.2bn.
Market Data | Oct 26, 2018
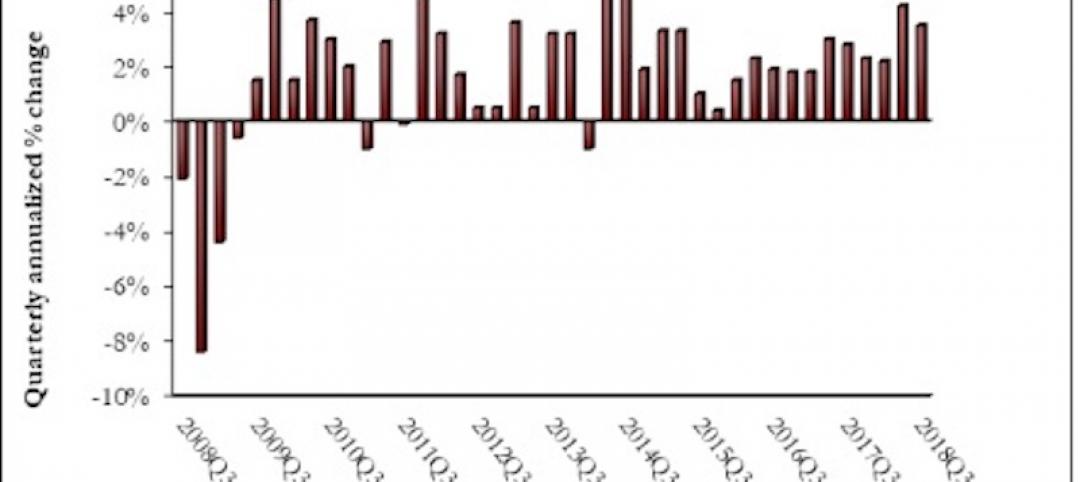
Nonresidential fixed investment returns to earth in Q3
Despite the broader economic growth, fixed investment inched 0.3% lower in the third quarter.
Market Data | Oct 24, 2018
Architecture firm billings slow but remain positive in September
Billings growth slows but is stable across sectors.
Market Data | Oct 19, 2018
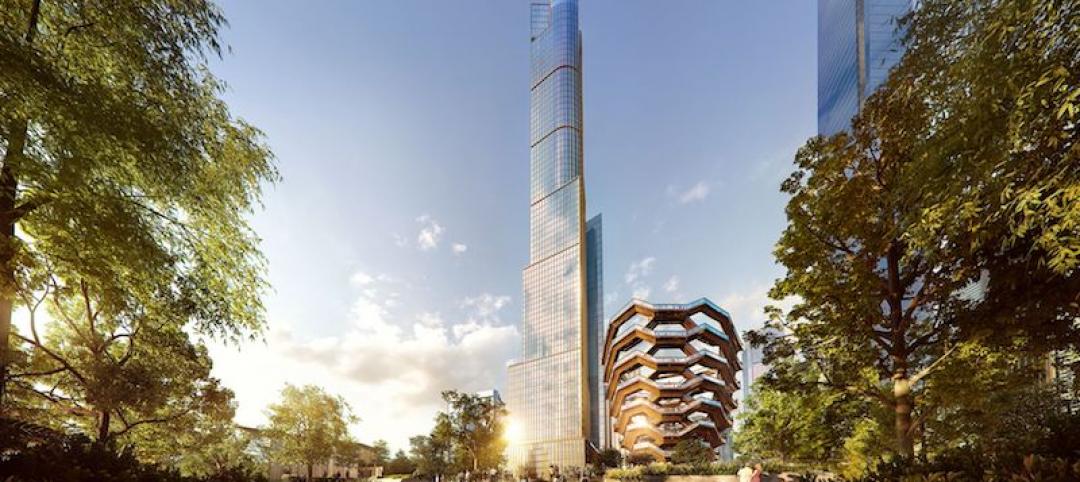
New York’s five-year construction spending boom could be slowing over the next two years
Nonresidential building could still add more than 90 million sf through 2020.

Market Data | Oct 8, 2018
Global construction set to rise to US$12.9 trillion by 2022, driven by Asia Pacific, Africa and the Middle East
The pace of global construction growth is set to improve slightly to 3.7% between 2019 and 2020.
Market Data | Sep 25, 2018
Contractors remain upbeat in Q2, according to ABC’s latest Construction Confidence Index
More than three in four construction firms expect that sales will continue to rise over the next six months, while three in five expect higher profit margins.

Market Data | Sep 24, 2018
Hotel construction pipeline reaches record highs
There are 5,988 projects/1,133,017 rooms currently under construction worldwide.
Market Data | Sep 21, 2018
JLL fit out report portrays a hot but tenant-favorable office market
This year’s analysis draws from 2,800 projects.


