

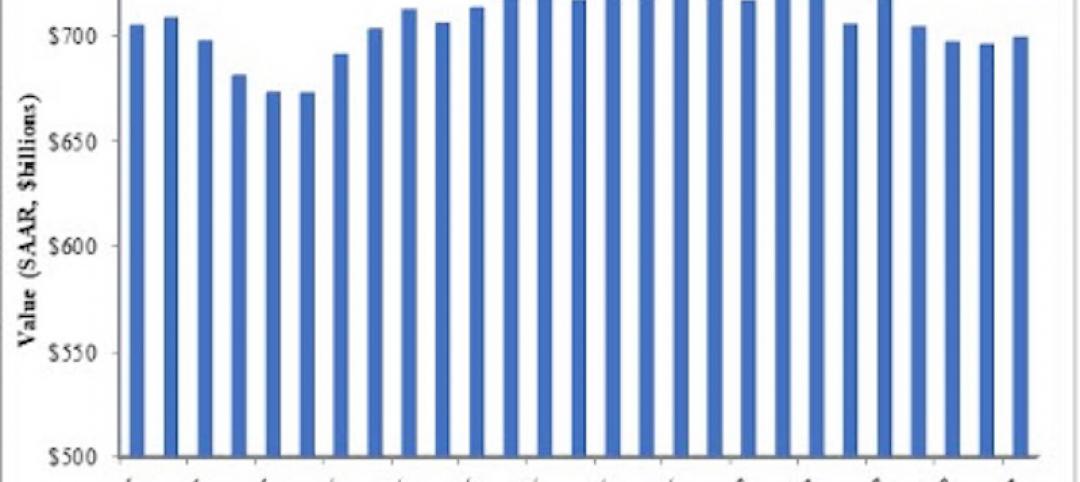
The Architecture Billings Index (ABI) concluded the year in positive terrain, with the December reading capping off three straight months of growth in design billings. As a leading economic indicator of construction activity, the ABI reflects the approximate nine to twelve month lead time between architecture billings and construction spending. The American Institute of Architects (AIA) reported the December ABI score was 55.9, up sharply from 50.6 in the previous month. This score reflects the largest increase in design services in 2016 (any score above 50 indicates an increase in billings). The new projects inquiry index was 57.2, down from a reading of 59.5 the previous month.
“The sharp upturn in design activity as we wind down the year is certainly encouraging. This bodes well for the design and construction sector as we enter the new year”,” says AIA Chief Economist, Kermit Baker, Hon. AIA, PhD, in a press release. “However, December is an atypical month for interpreting trends, so the coming months will tell us a lot more about conditions that the industry is likely to see in 2017.”
Key December ABI highlights:
· Regional averages: Midwest (54.4), Northeast (54.0), South (53.8), West (48.8)
· Sector index breakdown: commercial / industrial (54.3), institutional (53.3), mixed practice (51.9), multi-family residential (50.6)
· Project inquiries index: 57.2
· Design contracts index: 51.2
The regional and sector categories are calculated as a 3-month moving average, whereas the national index, design contracts and inquiries are monthly numbers.
Related Stories

Market Data | Dec 5, 2017
Top health systems engaged in $21 billion of U.S. construction projects
Largest active projects are by Sutter Health, New York Presbyterian, and Scripps Health.

Industry Research | Nov 28, 2017
2018 outlook: Economists point to slowdown, AEC professionals say ‘no way’
Multifamily housing and senior living developments head the list of the hottest sectors heading into 2018, according a survey of 356 AEC professionals.
Market Data | Nov 27, 2017
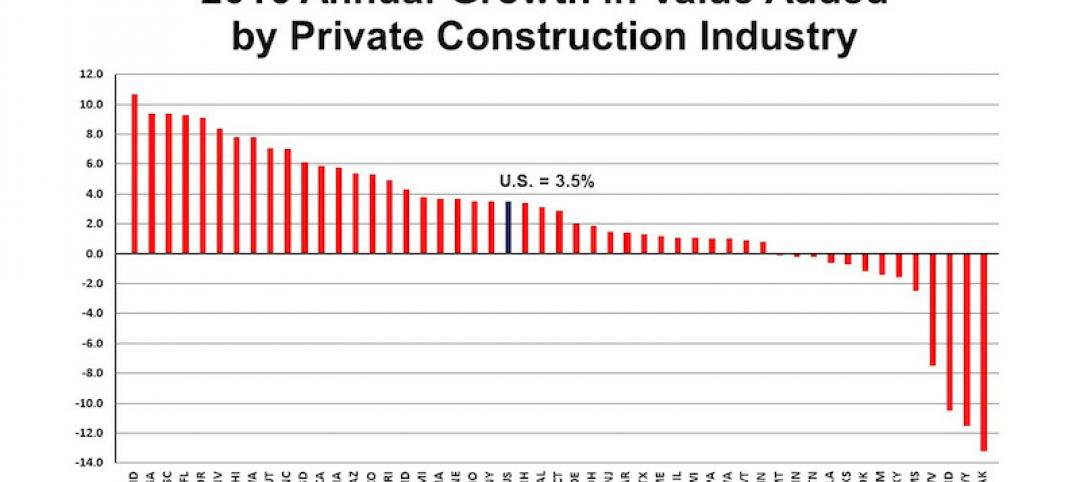
Construction's contribution to U.S. economy highest in seven years
Thirty-seven states benefited from the rise in construction activity in their state, while 13 states experienced a reduction in activity.
Market Data | Nov 15, 2017
Architecture Billings bounce back
Business conditions remain uneven across regions.
Market Data | Nov 14, 2017
U.S. construction starts had three consecutive quarters of positive growth in 2017
ConstructConnect’s quarterly report shows the most significant annual growth in the civil engineering and residential sectors.

Market Data | Nov 3, 2017
New construction starts in 2018 to increase 3% to $765 billion: Dodge report
Dodge Outlook Report predicts deceleration but still growth, reflecting a mixed pattern by project type.
Market Data | Nov 2, 2017
Construction spending up in September; Down on a YOY basis
Nonresidential construction spending is down 2.9% on a year-over-year basis.
Market Data | Oct 19, 2017
Architecture Billings Index backslides slightly
Business conditions easing in the West.

Industry Research | Oct 3, 2017
Nonresidential construction spending stabilizes in August
Spending on nonresidential construction services is still down on a YOY basis.

Market Data | Sep 21, 2017
Architecture Billings Index continues growth streak
Design services remain in high demand across all regions and in all major sectors.


