

The Architecture Billings Index (ABI) concluded the year in positive terrain, with the December reading capping off three straight months of growth in design billings. As a leading economic indicator of construction activity, the ABI reflects the approximate nine to twelve month lead time between architecture billings and construction spending. The American Institute of Architects (AIA) reported the December ABI score was 55.9, up sharply from 50.6 in the previous month. This score reflects the largest increase in design services in 2016 (any score above 50 indicates an increase in billings). The new projects inquiry index was 57.2, down from a reading of 59.5 the previous month.
“The sharp upturn in design activity as we wind down the year is certainly encouraging. This bodes well for the design and construction sector as we enter the new year”,” says AIA Chief Economist, Kermit Baker, Hon. AIA, PhD, in a press release. “However, December is an atypical month for interpreting trends, so the coming months will tell us a lot more about conditions that the industry is likely to see in 2017.”
Key December ABI highlights:
· Regional averages: Midwest (54.4), Northeast (54.0), South (53.8), West (48.8)
· Sector index breakdown: commercial / industrial (54.3), institutional (53.3), mixed practice (51.9), multi-family residential (50.6)
· Project inquiries index: 57.2
· Design contracts index: 51.2
The regional and sector categories are calculated as a 3-month moving average, whereas the national index, design contracts and inquiries are monthly numbers.
Related Stories

Market Data | Jan 24, 2018
HomeUnion names the most and least affordable rental housing markets
Chicago tops the list as the most affordable U.S. metro, while Oakland, Calif., is the most expensive rental market.

Market Data | Jan 12, 2018
Construction input prices inch down in December, Up YOY despite low inflation
Energy prices have been more volatile lately.

Market Data | Jan 4, 2018
Nonresidential construction spending ticks higher in November, down year-over-year
Despite the month-over-month expansion, nonresidential spending fell 1.3 percent from November 2016.

Contractors | Jan 4, 2018
Construction spending in a ‘mature’ period of incremental growth
Labor shortages are spiking wages. Materials costs are rising, too.
 reported the November ABI score was 55.0, up from a score of 51.7 in the previous month. Photo: Pixabay")
Market Data | Dec 20, 2017
Architecture billings upturn shows broad strength
The American Institute of Architects (AIA) reported the November ABI score was 55.0, up from a score of 51.7 in the previous month.

Market Data | Dec 14, 2017
ABC chief economist predicts stable 2018 construction economy
There are risks to the 2018 outlook as a number of potential cost increases could come into play.

Market Data | Dec 13, 2017
Top world regions and markets in the global hotel construction pipeline
The top world region by project count is North America.

Market Data | Dec 11, 2017
Global hotel construction pipeline is growing
The Total Pipeline stands at 12,427 Projects/2,084,940 Rooms.
Market Data | Dec 11, 2017
Construction backlog surges, sets record in third quarter
CBI is a leading economic indicator that reflects the amount of construction work under contract, but not yet completed.
Market Data | Dec 7, 2017
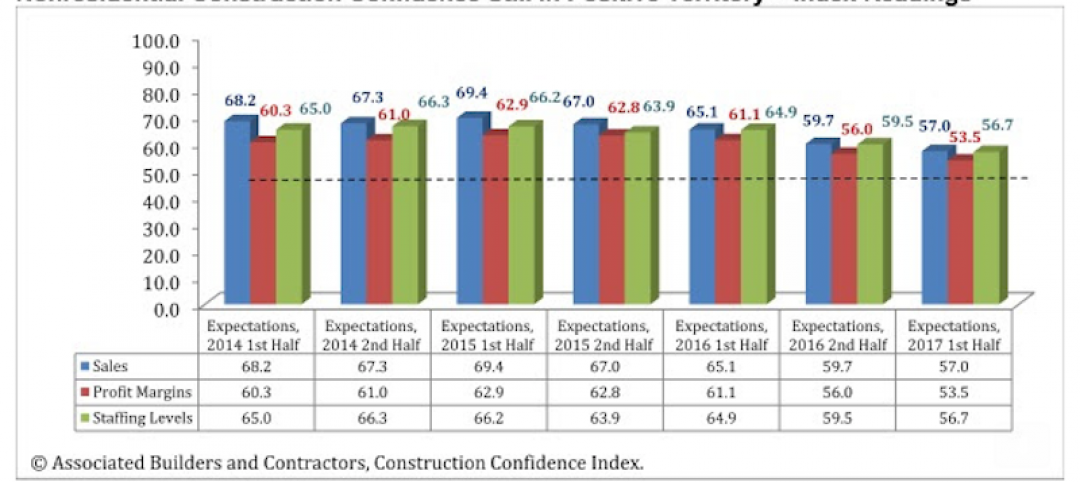
Buoyed by healthy economy, ABC Index finds contractors upbeat
Despite rising construction labor and materials costs, 55% of contractors expect their profit margins to expand in the first half of 2018.


