

Demand for design services from U.S. architecture firms continues to grow at a vigorous pace, according to a new report today from The American Institute of Architects (AIA).
AIA’s Architecture Billings Index (ABI) score for May rose to 58.5 compared to 57.9 in April (any score above 50 indicates an increase in billings). May’s ABI score is one of the highest in the index’s 25-year history. During May, the new design contracts score reached its second consecutive record high with a score of 63.2, while new project inquiries also recorded a near-record high score at 69.2.
“Despite ballooning costs for construction materials and delivery delays, design activity is roaring back as more and more places reopen,” said AIA Chief Economist Kermit Baker, Hon. AIA, PhD. “However, concern over rising inflation and ongoing supply chain disruptions, as well as emerging labor shortages, could dampen the emerging construction recovery.”
Key ABI highlights for May include:
• Regional averages: Midwest (63.4); South (59.0); West (57.4); Northeast (54.2)
• Sector index breakdown: commercial/industrial (60.6); multi-family residential (59.5); mixed practice (57.9); institutional (57.1)
• Project inquiries index: 69.2
• Design contracts index: 63.2
The regional and sector categories are calculated as a three-month moving average, whereas the national index, design contracts and inquiries are monthly numbers.
Visit AIA’s website for more ABI information.
Related Stories
Market Data | Nov 20, 2018
Construction employment rises from October 2017 to October 2018 in 44 states and D.C.
Texas has biggest annual job increase while New Jersey continues losses; Iowa, Florida and California have largest one-month gains as Mississippi and Louisiana trail.
Market Data | Nov 15, 2018
Architecture firm billings continue to slow, but remain positive in October
Southern region reports decline in billings for the first time since June 2012.
Market Data | Nov 14, 2018
A new Joint Center report finds aging Americans less prepared to afford housing
The study foresees a significant segment of seniors struggling to buy or rent on their own or with other people.

Market Data | Nov 12, 2018
Leading hotel markets in the U.S. construction pipeline
Projects already under construction and those scheduled to start construction in the next 12 months, combined, have a total of 3,782 projects/213,798 rooms and are at cyclical highs.

Market Data | Nov 6, 2018
Unflagging national office market enjoys economic tailwinds
Stable vacancy helped push asking rents 4% higher in third quarter.
Market Data | Nov 2, 2018
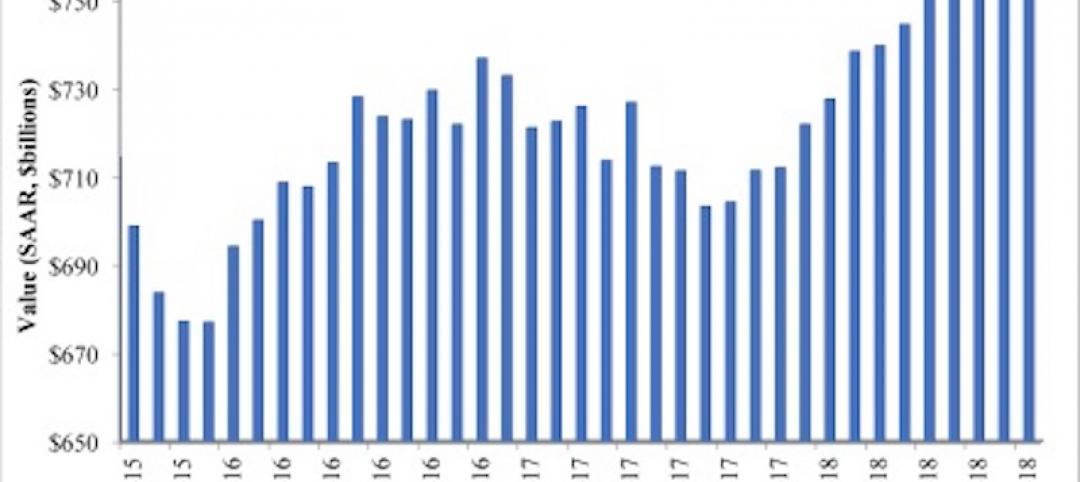
Nonresidential spending retains momentum in September, up 8.9% year over year
Total nonresidential spending stood at $767.1 billion on a seasonally adjusted, annualized rate in September.

Market Data | Oct 30, 2018
Construction projects planned and ongoing by world’s megacities valued at $4.2trn
The report states that Dubai tops the list with total project values amounting to US$374.2bn.
Market Data | Oct 26, 2018
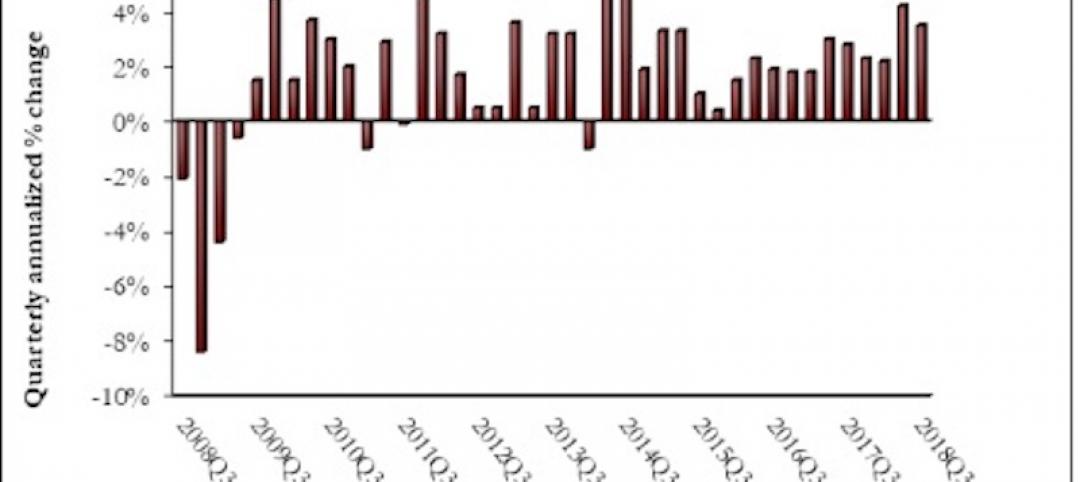
Nonresidential fixed investment returns to earth in Q3
Despite the broader economic growth, fixed investment inched 0.3% lower in the third quarter.
Market Data | Oct 24, 2018
Architecture firm billings slow but remain positive in September
Billings growth slows but is stable across sectors.

Market Data | Oct 19, 2018
New York’s five-year construction spending boom could be slowing over the next two years
Nonresidential building could still add more than 90 million sf through 2020.


