


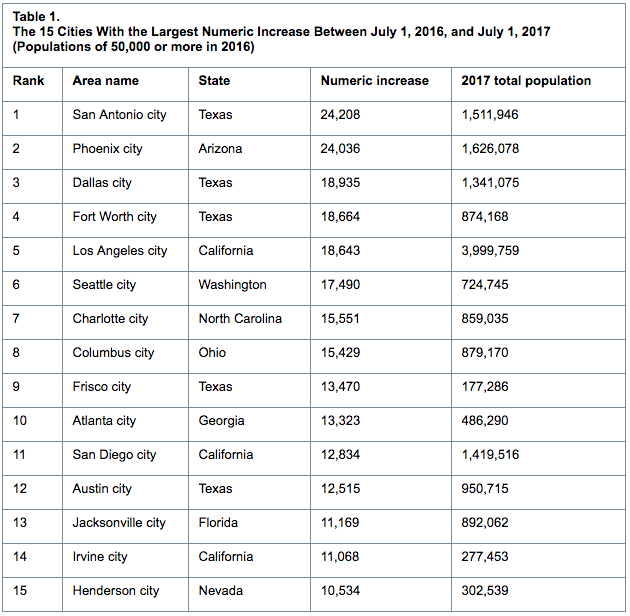
Eight of the 15 cities or towns with the largest population gains were located in the South in 2017, with three of the top five in Texas, according to new population estimates released by the U.S. Census Bureau.
“San Antonio, Texas, tops the list with the largest population gain with an increase of over 24,200 people, an average of 66 people per day between 2016 and 2017,” said Amel Toukabri, a demographer in the Population Division of the Census Bureau. “That’s a growth rate of 1.6%. This growth was enough to push San Antonio's population above the 1.5 million mark.”
Some of the other cities with the largest population gains were Phoenix, Ariz. (24,000); Dallas, Texas (18,900); Fort Worth, Texas (18,700); Los Angeles, Calif. (18,600); Seattle, Washington (17,500); and Charlotte, N.C. (15,600).
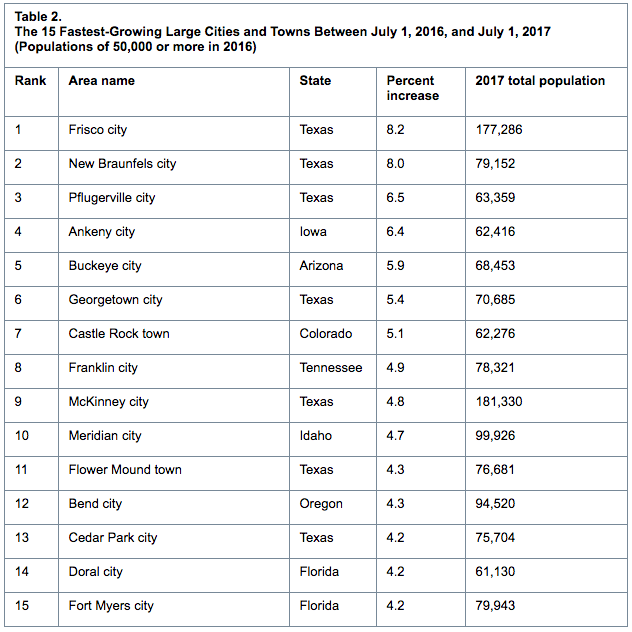
Regarding percentage change in population, 10 of the 15 fastest-growing large cities were located in the South, with seven in Texas. Between 2016 and 2017, Frisco, Texas (near Dallas), was the fastest-growing large city (population of 50,000 or more) at 8.2%, making its growth rate more than 11 times faster than the nation’s growth rate of 0.7%.
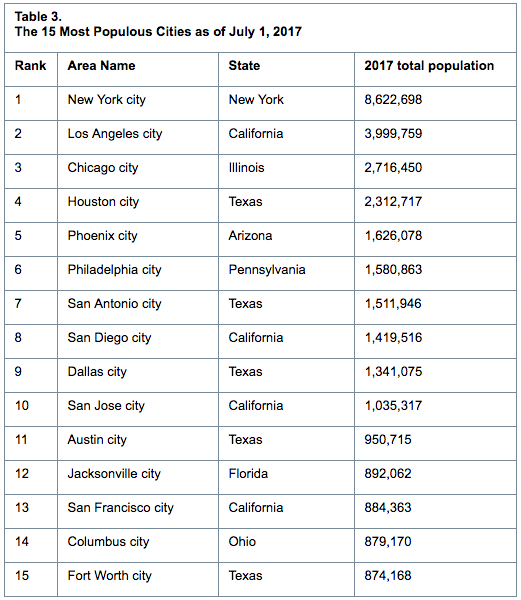
Fort Worth, Texas, surpassed Indianapolis, Ind., becoming the 15th largest city in the United States with a population of 874,168. Indianapolis has a population of 863,002. The 14 largest U.S.cities have not changed since 2016.
 Source: U.S. Census Bureau
While the main focus of this release has been on the 3.9% of cities with populations of 50,000 or more, the United States is a nation of small towns. Of the nation’s 325.7 million people, an estimated 205.0 million (62.9%) live within an incorporated place as of July 1, 2017. Of approximately 19,500 incorporated places, about 76% had fewer than 5,000 people and nearly 50% had fewer than 1,000 people.
Regional Growth
The West had the highest share of its population living within an incorporated place (76.7%), followed by the Midwest (71.4%) as of July 1, 2017. The Northeast had the smallest population of its residents living in incorporated places (51.4%).
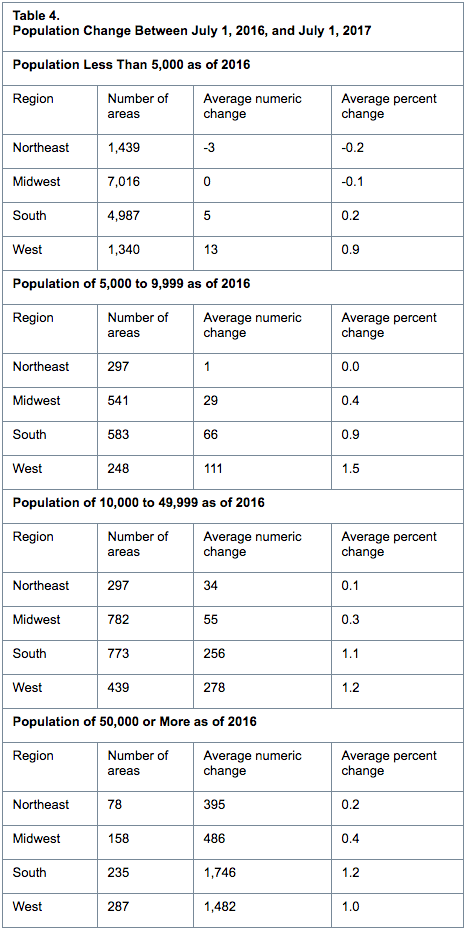
The South had the most city dwellers of any region at 67.9 million. However, this accounted for only 54.9% of the South’s 123.7 million total population. Since the 2010 Census, large cities in the South and West have led the nation in population growth, with an average increase of 10.0% (16,206) and 7.8% (12,256), respectively. By comparison, those in the Northeast and Midwest grew on average by 2.2% (9,104) and 3.0% (3,942), respectively.
The nation’s housing stock grew by more than one million last year, reaching over 137 million units. The growth rate of 0.8% from 2016 to 2017 was slower than the 1.4% a decade ago between 2006 and 2007.
 Source: U.S. Census Bureau
Housing unit growth last year remained below 2007 levels in nearly all states except North Dakota (up 1.0% last year, compared to a 0.9% increase in 2007); the District of Columbia (up 1.1%, compared to a 0.9% increase in 2007); South Dakota (up 1.4%, compared to a 1.2% increase in 2007); Iowa (up 0.9%, compared to a 0.7% increase in 2007); and Nebraska (returned to the 2007 growth rate of 0.8%).
Between July 1, 2016, and July 1, 2017, Utah was the fastest-growing state in terms of housing units, with an increase of 2.1%. Idaho and Colorado were the second- and third-fastest growing states with increases of 1.7% and 1.6%, respectively. West Virginia and Rhode Island were tied as the slowest-growing states with increases of 0.2%.
The nation’s housing stock increased by 5.7 million units (4.3%) since April 1, 2010. North Dakota was the fastest-growing state in terms of housing units, with an increase of 18.0% during the same period. Rounding out the top five states in percent gain were Utah (10.7%), Texas (9.6%), Idaho (8.1%) and South Dakota (8.0%).
Fourteen states added more than 100,000 housing units between April 1, 2010, and July 1, 2017. In terms of the largest numeric increase, the top five were Texas (955,000), California (497,000), Florida (452,000), North Carolina (295,000) and New York (219,000).
 Source: U.S. Census Bureau
 Source: U.S. Census Bureau
Related Stories

Contractors | Oct 5, 2022
Materials shortages, cost spikes throwing Design-Bid-Build process out of whack
The traditional Design-Bid-Build delivery process is under considerable stress this year as materials shortages and cost spikes are upending usual practices, according to a new report from JLL.

Green | Oct 5, 2022
In California, a public power provider’s new headquarters serves as a test case for an innovative microgrid and for reducing greenhouse gas emissions
Sonoma Clean Power (SCP), the public power provider for California’s Sonoma and Mendocino Counties, recently unveiled its new all-electric headquarters.

Contractors | Oct 4, 2022
Which comes first, the building or the cost estimate?
At the start of a project, don’t forget to establish financial parameters when you’re discussing the design and program. By establishing the costs up front, you can avoid the pitfalls that might derail your project and guarantee its lasting success.

Fire and Life Safety | Oct 4, 2022
Fire safety considerations for cantilevered buildings
Bold cantilevered designs are prevalent today, as developers and architects strive to maximize space, views, and natural light in buildings. Cantilevered structures, however, present a host of challenges for building teams, according to José R. Rivera, PE, Associate Principal and Director of Plumbing and Fire Protection with Lilker.

| Oct 4, 2022
Rental property owners want access to utility usage data for whole properties
As pressure from investors for ESG reporting mounts, owners of multifamily properties increasingly look to collect whole-building utility usage data.

| Oct 4, 2022
In dire need of affordable housing, Aspen, Colo. will get a development that provides 277 affordable homes
A few miles from downtown Aspen, Colo., a development will provide 277 new affordable homes for an area experiencing a dire affordable housing crisis.

Green | Oct 3, 2022
California regulators move to ban gas heaters for existing buildings
California regulators voted unanimously recently on a series of measures that include a ban on the sale of natural gas-powered heating and hot water systems beginning in 2030.

| Oct 3, 2022
The College of the Holy Cross completes a $110 million performing arts center
In Worcester, Mass., a one-hour drive from Boston, the College of the Holy Cross has completed its $110 million Prior Performing Arts Center.

Resiliency | Sep 30, 2022
Designing buildings for wildfire defensibility
Wold Architects and Engineers' Senior Planner Ryan Downs, AIA, talks about how to make structures and communities more fire-resistant.

| Sep 30, 2022
Manley Spangler Smith Architects partners with PBK in strategic merger
Manley Spangler Smith Architects (MSSA), a Georgia-based, full-service architectural firm specializing in educational and municipal facilities, announced today a significant development aimed at increasing its capabilities, expertise, and suite of services.


