


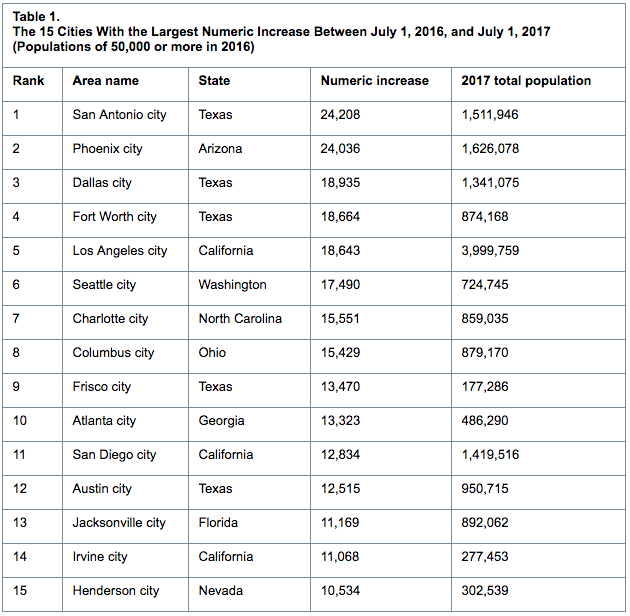
Eight of the 15 cities or towns with the largest population gains were located in the South in 2017, with three of the top five in Texas, according to new population estimates released by the U.S. Census Bureau.
“San Antonio, Texas, tops the list with the largest population gain with an increase of over 24,200 people, an average of 66 people per day between 2016 and 2017,” said Amel Toukabri, a demographer in the Population Division of the Census Bureau. “That’s a growth rate of 1.6%. This growth was enough to push San Antonio's population above the 1.5 million mark.”
Some of the other cities with the largest population gains were Phoenix, Ariz. (24,000); Dallas, Texas (18,900); Fort Worth, Texas (18,700); Los Angeles, Calif. (18,600); Seattle, Washington (17,500); and Charlotte, N.C. (15,600).
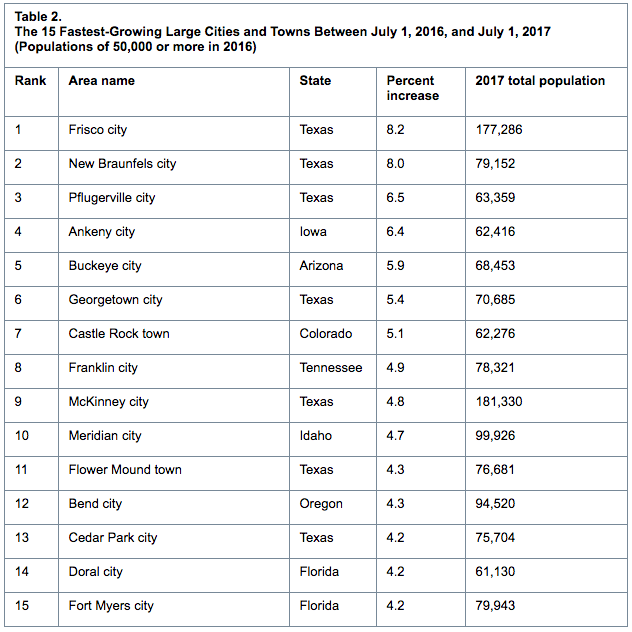
Regarding percentage change in population, 10 of the 15 fastest-growing large cities were located in the South, with seven in Texas. Between 2016 and 2017, Frisco, Texas (near Dallas), was the fastest-growing large city (population of 50,000 or more) at 8.2%, making its growth rate more than 11 times faster than the nation’s growth rate of 0.7%.
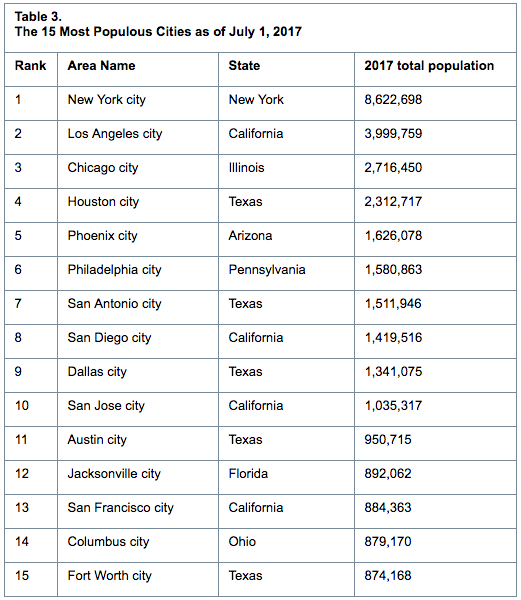
Fort Worth, Texas, surpassed Indianapolis, Ind., becoming the 15th largest city in the United States with a population of 874,168. Indianapolis has a population of 863,002. The 14 largest U.S.cities have not changed since 2016.
 Source: U.S. Census Bureau
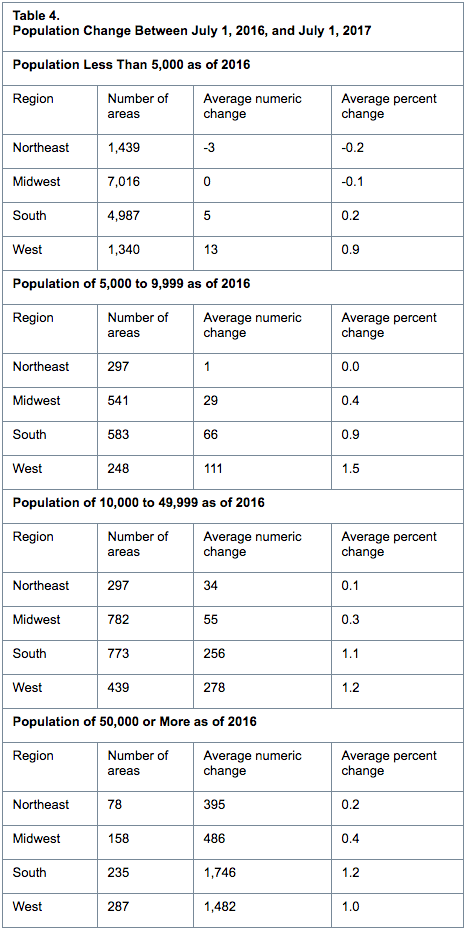
While the main focus of this release has been on the 3.9% of cities with populations of 50,000 or more, the United States is a nation of small towns. Of the nation’s 325.7 million people, an estimated 205.0 million (62.9%) live within an incorporated place as of July 1, 2017. Of approximately 19,500 incorporated places, about 76% had fewer than 5,000 people and nearly 50% had fewer than 1,000 people.
Regional Growth
The West had the highest share of its population living within an incorporated place (76.7%), followed by the Midwest (71.4%) as of July 1, 2017. The Northeast had the smallest population of its residents living in incorporated places (51.4%).
The South had the most city dwellers of any region at 67.9 million. However, this accounted for only 54.9% of the South’s 123.7 million total population. Since the 2010 Census, large cities in the South and West have led the nation in population growth, with an average increase of 10.0% (16,206) and 7.8% (12,256), respectively. By comparison, those in the Northeast and Midwest grew on average by 2.2% (9,104) and 3.0% (3,942), respectively.
The nation’s housing stock grew by more than one million last year, reaching over 137 million units. The growth rate of 0.8% from 2016 to 2017 was slower than the 1.4% a decade ago between 2006 and 2007.
 Source: U.S. Census Bureau
Housing unit growth last year remained below 2007 levels in nearly all states except North Dakota (up 1.0% last year, compared to a 0.9% increase in 2007); the District of Columbia (up 1.1%, compared to a 0.9% increase in 2007); South Dakota (up 1.4%, compared to a 1.2% increase in 2007); Iowa (up 0.9%, compared to a 0.7% increase in 2007); and Nebraska (returned to the 2007 growth rate of 0.8%).
Between July 1, 2016, and July 1, 2017, Utah was the fastest-growing state in terms of housing units, with an increase of 2.1%. Idaho and Colorado were the second- and third-fastest growing states with increases of 1.7% and 1.6%, respectively. West Virginia and Rhode Island were tied as the slowest-growing states with increases of 0.2%.
The nation’s housing stock increased by 5.7 million units (4.3%) since April 1, 2010. North Dakota was the fastest-growing state in terms of housing units, with an increase of 18.0% during the same period. Rounding out the top five states in percent gain were Utah (10.7%), Texas (9.6%), Idaho (8.1%) and South Dakota (8.0%).
Fourteen states added more than 100,000 housing units between April 1, 2010, and July 1, 2017. In terms of the largest numeric increase, the top five were Texas (955,000), California (497,000), Florida (452,000), North Carolina (295,000) and New York (219,000).
 Source: U.S. Census Bureau
 Source: U.S. Census Bureau
Related Stories

Market Data | Mar 14, 2024
Download BD+C's March 2024 Market Intelligence Report
U.S. construction spending on buildings-related work rose 1.4% in January, but project teams continue to face headwinds related to inflation, interest rates, and supply chain issues, according to Building Design+Construction's March 2024 Market Intelligence Report (free PDF download).

Contractors | Mar 12, 2024
The average U.S. contractor has 8.1 months worth of construction work in the pipeline, as of February 2024
Associated Builders and Contractors reported that its Construction Backlog Indicator declined to 8.1 months in February, according to an ABC member survey conducted Feb. 20 to March 5. The reading is down 1.1 months from February 2023.

Market Data | Mar 6, 2024
Nonresidential construction spending slips 0.4% in January
National nonresidential construction spending decreased 0.4% in January, according to an Associated Builders and Contractors analysis of data published today by the U.S. Census Bureau. On a seasonally adjusted annualized basis, nonresidential spending totaled $1.190 trillion.

Multifamily Housing | Mar 4, 2024
Single-family rentals continue to grow in BTR communities
Single-family rentals are continuing to grow in built-to-rent communities. Both rent and occupancy growth have been strong in recent months while remaining a financially viable option for renters.

MFPRO+ News | Mar 2, 2024
Job gains boost Yardi Matrix National Rent Forecast for 2024
Multifamily asking rents broke the five-month streak of sequential average declines in January, rising 0.07 percent, shows a new special report from Yardi Matrix.

K-12 Schools | Feb 29, 2024
Average age of U.S. school buildings is just under 50 years
The average age of a main instructional school building in the United States is 49 years, according to a survey by the National Center for Education Statistics (NCES). About 38% of schools were built before 1970. Roughly half of the schools surveyed have undergone a major building renovation or addition.

MFPRO+ Research | Feb 27, 2024
Most competitive rental markets of early 2024
The U.S. rental market in early 2024 is moderately competitive, with apartments taking an average of 41 days to find tenants, according to the latest RentCafe Market Competitivity Report.

Construction Costs | Feb 22, 2024
K-12 school construction costs for 2024
Data from Gordian breaks down the average cost per square foot for four different types of K-12 school buildings (elementary schools, junior high schools, high schools, and vocational schools) across 10 U.S. cities.

Student Housing | Feb 21, 2024
Student housing preleasing continues to grow at record pace
Student housing preleasing continues to be robust even as rent growth has decelerated, according to the latest Yardi Matrix National Student Housing Report.

Architects | Feb 21, 2024
Architecture Billings Index remains in 'declining billings' state in January 2024
Architecture firm billings remained soft entering into 2024, with an AIA/Deltek Architecture Billings Index (ABI) score of 46.2 in January. Any score below 50.0 indicates decreasing business conditions.


