


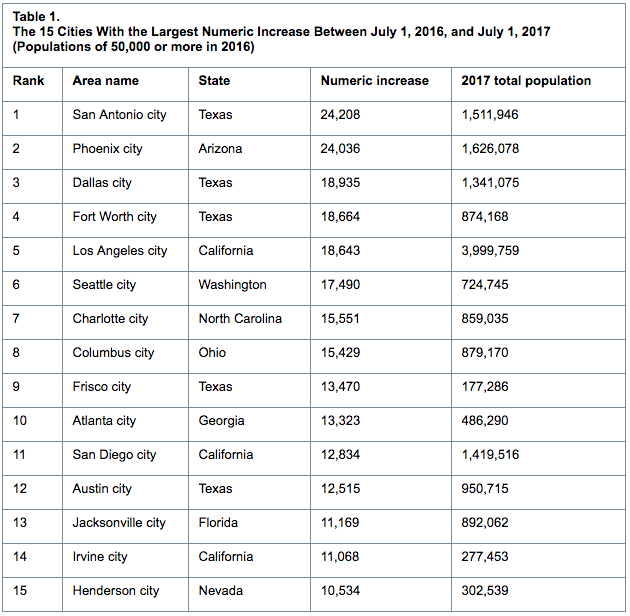
Eight of the 15 cities or towns with the largest population gains were located in the South in 2017, with three of the top five in Texas, according to new population estimates released by the U.S. Census Bureau.
“San Antonio, Texas, tops the list with the largest population gain with an increase of over 24,200 people, an average of 66 people per day between 2016 and 2017,” said Amel Toukabri, a demographer in the Population Division of the Census Bureau. “That’s a growth rate of 1.6%. This growth was enough to push San Antonio's population above the 1.5 million mark.”
Some of the other cities with the largest population gains were Phoenix, Ariz. (24,000); Dallas, Texas (18,900); Fort Worth, Texas (18,700); Los Angeles, Calif. (18,600); Seattle, Washington (17,500); and Charlotte, N.C. (15,600).
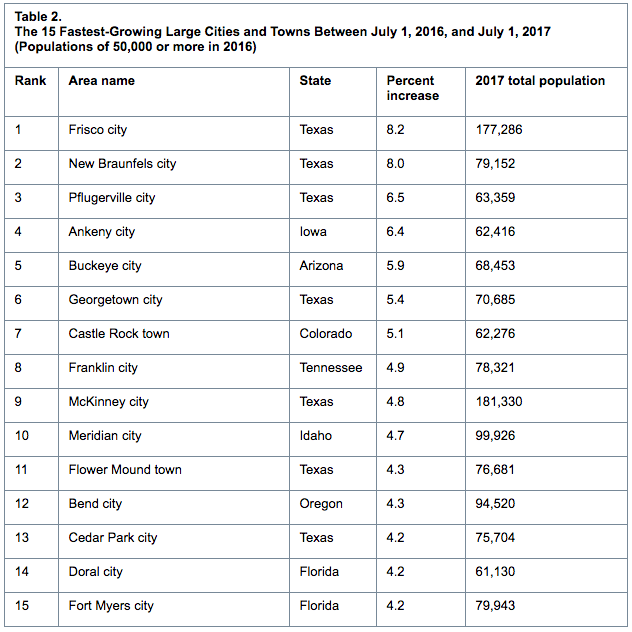
Regarding percentage change in population, 10 of the 15 fastest-growing large cities were located in the South, with seven in Texas. Between 2016 and 2017, Frisco, Texas (near Dallas), was the fastest-growing large city (population of 50,000 or more) at 8.2%, making its growth rate more than 11 times faster than the nation’s growth rate of 0.7%.
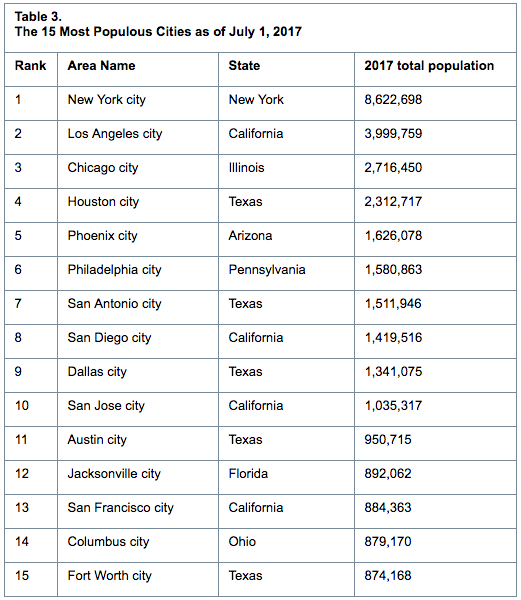
Fort Worth, Texas, surpassed Indianapolis, Ind., becoming the 15th largest city in the United States with a population of 874,168. Indianapolis has a population of 863,002. The 14 largest U.S.cities have not changed since 2016.
 Source: U.S. Census Bureau
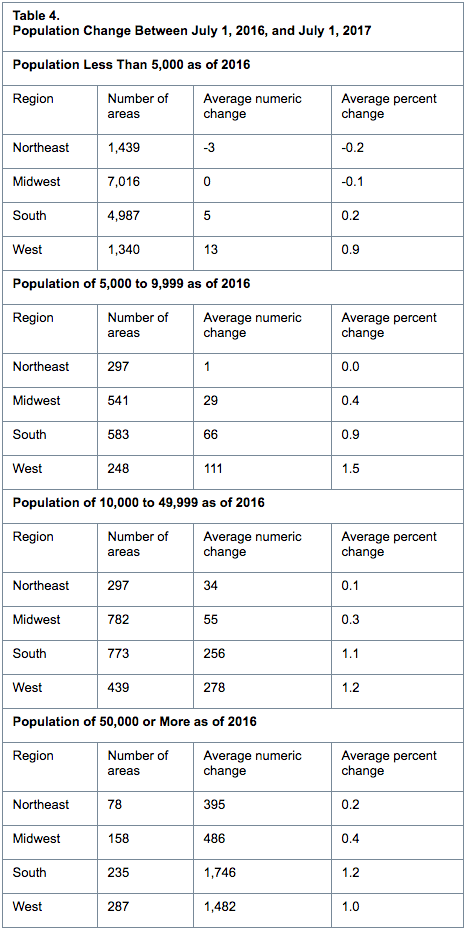
While the main focus of this release has been on the 3.9% of cities with populations of 50,000 or more, the United States is a nation of small towns. Of the nation’s 325.7 million people, an estimated 205.0 million (62.9%) live within an incorporated place as of July 1, 2017. Of approximately 19,500 incorporated places, about 76% had fewer than 5,000 people and nearly 50% had fewer than 1,000 people.
Regional Growth
The West had the highest share of its population living within an incorporated place (76.7%), followed by the Midwest (71.4%) as of July 1, 2017. The Northeast had the smallest population of its residents living in incorporated places (51.4%).
The South had the most city dwellers of any region at 67.9 million. However, this accounted for only 54.9% of the South’s 123.7 million total population. Since the 2010 Census, large cities in the South and West have led the nation in population growth, with an average increase of 10.0% (16,206) and 7.8% (12,256), respectively. By comparison, those in the Northeast and Midwest grew on average by 2.2% (9,104) and 3.0% (3,942), respectively.
The nation’s housing stock grew by more than one million last year, reaching over 137 million units. The growth rate of 0.8% from 2016 to 2017 was slower than the 1.4% a decade ago between 2006 and 2007.
 Source: U.S. Census Bureau
Housing unit growth last year remained below 2007 levels in nearly all states except North Dakota (up 1.0% last year, compared to a 0.9% increase in 2007); the District of Columbia (up 1.1%, compared to a 0.9% increase in 2007); South Dakota (up 1.4%, compared to a 1.2% increase in 2007); Iowa (up 0.9%, compared to a 0.7% increase in 2007); and Nebraska (returned to the 2007 growth rate of 0.8%).
Between July 1, 2016, and July 1, 2017, Utah was the fastest-growing state in terms of housing units, with an increase of 2.1%. Idaho and Colorado were the second- and third-fastest growing states with increases of 1.7% and 1.6%, respectively. West Virginia and Rhode Island were tied as the slowest-growing states with increases of 0.2%.
The nation’s housing stock increased by 5.7 million units (4.3%) since April 1, 2010. North Dakota was the fastest-growing state in terms of housing units, with an increase of 18.0% during the same period. Rounding out the top five states in percent gain were Utah (10.7%), Texas (9.6%), Idaho (8.1%) and South Dakota (8.0%).
Fourteen states added more than 100,000 housing units between April 1, 2010, and July 1, 2017. In terms of the largest numeric increase, the top five were Texas (955,000), California (497,000), Florida (452,000), North Carolina (295,000) and New York (219,000).
 Source: U.S. Census Bureau
 Source: U.S. Census Bureau
Related Stories
| Jun 5, 2023
Communication is the key to AEC firms’ mental health programs and training
The core of recent awareness efforts—and their greatest challenge—is getting workers to come forward and share stories.

Contractors | May 24, 2023
The average U.S. contractor has 8.9 months worth of construction work in the pipeline, as of April 2023
Contractor backlogs climbed slightly in April, from a seven-month low the previous month, according to Associated Builders and Contractors.

Multifamily Housing | May 23, 2023
One out of three office buildings in largest U.S. cities are suitable for residential conversion
Roughly one in three office buildings in the largest U.S. cities are well suited to be converted to multifamily residential properties, according to a study by global real estate firm Avison Young. Some 6,206 buildings across 10 U.S. cities present viable opportunities for conversion to residential use.

Industry Research | May 22, 2023
2023 High Growth Study shares tips for finding success in uncertain times
Lee Frederiksen, Managing Partner, Hinge, reveals key takeaways from the firm's recent High Growth study.

Multifamily Housing | May 8, 2023
The average multifamily rent was $1,709 in April 2023, up for the second straight month
Despite economic headwinds, the multifamily housing market continues to demonstrate resilience, according to a new Yardi Matrix report.

Market Data | May 2, 2023
Nonresidential construction spending up 0.7% in March 2023 versus previous month
National nonresidential construction spending increased by 0.7% in March, according to an Associated Builders and Contractors analysis of data published today by the U.S. Census Bureau. On a seasonally adjusted annualized basis, nonresidential spending totaled $997.1 billion for the month.

Hotel Facilities | May 2, 2023
U.S. hotel construction up 9% in the first quarter of 2023, led by Marriott and Hilton
In the latest United States Construction Pipeline Trend Report from Lodging Econometrics (LE), analysts report that construction pipeline projects in the U.S. continue to increase, standing at 5,545 projects/658,207 rooms at the close of Q1 2023. Up 9% by both projects and rooms year-over-year (YOY); project totals at Q1 ‘23 are just 338 projects, or 5.7%, behind the all-time high of 5,883 projects recorded in Q2 2008.

Market Data | May 1, 2023
AEC firm proposal activity rebounds in the first quarter of 2023: PSMJ report
Proposal activity for architecture, engineering and construction (A/E/C) firms increased significantly in the 1st Quarter of 2023, according to PSMJ’s Quarterly Market Forecast (QMF) survey. The predictive measure of the industry’s health rebounded to a net plus/minus index (NPMI) of 32.8 in the first three months of the year.

Industry Research | Apr 25, 2023
The commercial real estate sector shouldn’t panic (yet) about recent bank failures
A new Cushman & Wakefield report depicts a “well capitalized” banking industry that is responding assertively to isolated weaknesses, but is also tightening its lending.

Architects | Apr 21, 2023
Architecture billings improve slightly in March
Architecture firms reported a modest increase in March billings. This positive news was tempered by a slight decrease in new design contracts according to a new report released today from The American Institute of Architects (AIA). March was the first time since last September in which billings improved.


