


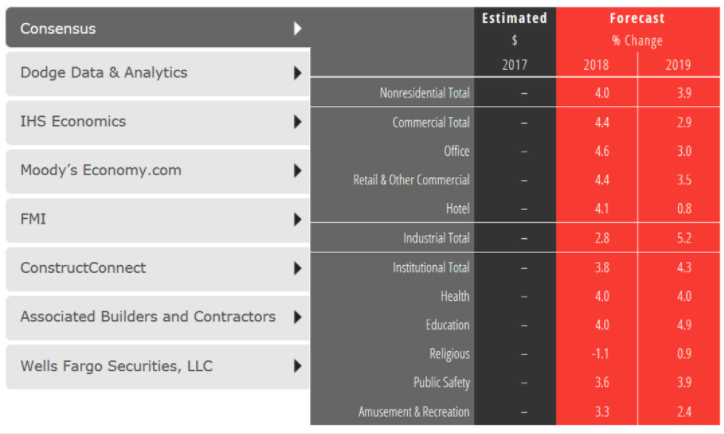
Despite labor shortages and rising material costs that continue to impact the construction sector, construction spending for nonresidential buildings is projected to increase 4.0% this year and continue at a 3.9% pace of growth through 2019.
The American Institute of Architects (AIA) semi-annual Consensus Construction Forecast indicates the commercial construction sectors will generate much of the expected gains this year, and by 2019 the industrial and institutional sectors will dominate the projected construction growth.
“Rebuilding after the record-breaking losses from natural disasters last year, the recently enacted tax reform bill, and the prospects of an infrastructure package are expected to provide opportunities for even more robust levels of activity within the industry,” said AIA Chief Economist, Kermit Baker, PhD, Hon. AIA. “The Architecture Billings Index (ABI) and other major leading indicators for the industry also point to an upturn in construction activity over the coming year.”
 CLICK TO VIEW INTERACTIVE CHART
Even eight and a half years into this current national economic cycle, the US economy remains on solid footings. Given the strong levels of business investment, economic growth is estimated to have been 2.2% to 2.3% range last year, easily topping the 1.5% growth from 2016. Over two million new payroll positions on net were added to the economy last year, the seventh straight year that payroll growth exceeded that level.
The national unemployment rate ended the year at 4.1%, its lowest level since 2000. And while low interest rates have helped to fuel this growth, rising stock prices have ensured that public companies have had access to capital to expand their operations. The Dow Jones industrial average increased almost 25% during the year.
However, in the face of a supportive economy, construction spending on nonresidential buildings disappointed last year. Overall spending on these facilities grew by only about 2.5%, with spending on manufacturing facilities seeing a steep double-digit decline.
The only sector achieving healthy growth was retail and other commercial facilities, an odd result given the numerous reports of failing shopping centers due to strong growth in e-commerce sales. However, much of the spending reported in the retail and other commercial facilities category was for distribution facilities and related logistic operations to support a more efficient e-commerce system.
Still, the slowdown in spending last year was sharper than expected. Annual 2015 increases were almost 16% across the entire nonresidential building category, with the office and lodging categories realizing strong gains, and the institutional categories posting increases of almost 8% overall.
Growth in activity eased in 2016, with overall spending on nonresidential buildings increasing by only 6% even though the office and lodging categories posted gains of nearly 25%. Spending on institutional facilities was disappointing, with increases totaling less than 2% in this category.
Related Stories
Market Data | Feb 2, 2022
Majority of metro areas added construction jobs in 2021
Soaring job openings indicate that labor shortages are only getting worse.
Market Data | Feb 2, 2022
Construction spending increased in December for the month and the year
Nonresidential and public construction lagged residential sector.

Market Data | Jan 31, 2022
Canada's hotel construction pipeline ends 2021 with 262 projects and 35,325 rooms
At the close of 2021, projects under construction stand at 62 projects/8,100 rooms.

Market Data | Jan 27, 2022
Record high counts for franchise companies in the early planning stage at the end of Q4'21
Through year-end 2021, Marriott, Hilton, and IHG branded hotels represented 585 new hotel openings with 73,415 rooms.

Market Data | Jan 27, 2022
Dallas leads as the top market by project count in the U.S. hotel construction pipeline at year-end 2021
The market with the greatest number of projects already in the ground, at the end of the fourth quarter, is New York with 90 projects/14,513 rooms.

Market Data | Jan 26, 2022
2022 construction forecast: Healthcare, retail, industrial sectors to lead ‘healthy rebound’ for nonresidential construction
A panel of construction industry economists forecasts 5.4 percent growth for the nonresidential building sector in 2022, and a 6.1 percent bump in 2023.

Market Data | Jan 24, 2022
U.S. hotel construction pipeline stands at 4,814 projects/581,953 rooms at year-end 2021
Projects scheduled to start construction in the next 12 months stand at 1,821 projects/210,890 rooms at the end of the fourth quarter.

Market Data | Jan 19, 2022
Architecture firms end 2021 on a strong note
December’s Architectural Billings Index (ABI) score of 52.0 was an increase from 51.0 in November.

Market Data | Jan 13, 2022
Materials prices soar 20% in 2021 despite moderating in December
Most contractors in association survey list costs as top concern in 2022.

Market Data | Jan 12, 2022
Construction firms forsee growing demand for most types of projects
Seventy-four percent of firms plan to hire in 2022 despite supply-chain and labor challenges.


