


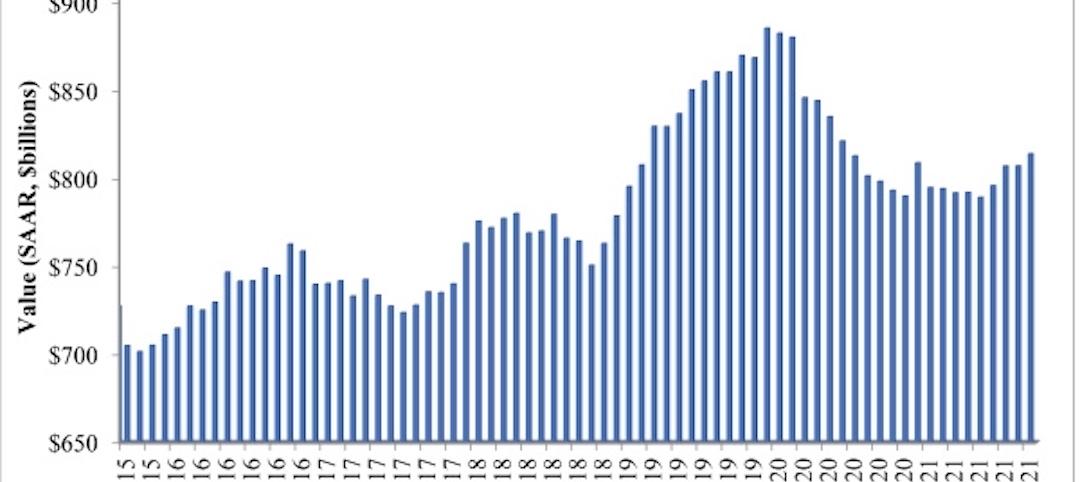
As has been the case a few times this year, the Architecture Billings Index (ABI) dipped in November.
As a leading economic indicator of construction activity, the ABI reflects the approximate nine to twelve month lead time between architecture billings and construction spending. The American Institute of Architects (AIA) reported the November ABI score was 49.3, down from the mark of 53.1 in the previous month. This score reflects a decrease in design services (any score above 50 indicates an increase in billings). The new projects inquiry index was 58.6, up just a nudge from a reading of 58.5 the previous month.
“Since architecture firms continue to report that they are bringing in new projects, this volatility in billings doesn’t seem to reflect any underlying weakness in the construction sector,” said AIA Chief Economist Kermit Baker, Hon. AIA, PhD. “Rather, it could reflect the uncertainty of moving ahead with projects given the continued tightness in construction financing and the growing labor shortage problem gripping the entire design and construction industries.”
Key November ABI highlights:
- Regional averages: South (55.4), West (54.5), Midwest (47.8), Northeast (46.2)
- Sector index breakdown: multi-family residential (53.8), institutional (51.4), commercial / industrial (55.1), mixed practice (54.9)
- Project inquiries index: 58.6
- Design contracts index: 53.5
The regional and sector categories are calculated as a 3-month moving average, whereas the national index, design contracts and inquiries are monthly numbers.
Related Stories

Market Data | Jan 6, 2022
A new survey offers a snapshot of New York’s construction market
Anchin’s poll of 20 AEC clients finds a “growing optimism,” but also multiple pressure points.
Market Data | Jan 3, 2022
Construction spending in November increases from October and year ago
Construction spending in November totaled $1.63 trillion at a seasonally adjusted annual rate.

Market Data | Dec 22, 2021
Two out of three metro areas add construction jobs from November 2020 to November 2021
Construction employment increased in 237 or 66% of 358 metro areas over the last 12 months.
Market Data | Dec 17, 2021
Construction jobs exceed pre-pandemic level in 18 states and D.C.
Firms struggle to find qualified workers to keep up with demand.
Market Data | Dec 15, 2021
Widespread steep increases in materials costs in November outrun prices for construction projects
Construction officials say efforts to address supply chain challenges have been insufficient.

Market Data | Dec 15, 2021
Demand for design services continues to grow
Changing conditions could be on the horizon.

Market Data | Dec 5, 2021
Construction adds 31,000 jobs in November
Gains were in all segments, but the industry will need even more workers as demand accelerates.
Market Data | Dec 5, 2021
Construction spending rebounds in October
Growth in most public and private nonresidential types is offsetting the decline in residential work.
Market Data | Dec 5, 2021
Nonresidential construction spending increases nearly 1% in October
Spending was up on a monthly basis in 13 of the 16 nonresidential subcategories.
Market Data | Nov 30, 2021
Two-thirds of metro areas add construction jobs from October 2020 to October 2021
The pandemic and supply chain woes may limit gains.


