


Sports and recreation architects have always worked in close consultation with their clients, seeking answers to hundreds of questions about everything from the program’s biggest needs to the building’s smallest details. To that end, architects host charrettes, employ surveys, hold open forums and perform informal interviews with program administrators, maintenance staff, students and anyone else with a stake in the completed project.
All of these are helpful — some are vital — but, unfortunately, each are limited in scope. For example, a survey can help gauge student interest in particular activities or in raising their fees to pay for a facility, but a traditional survey can’t reach enough respondents or be of sufficient detail to give a full picture of the current (or desired) user experience.
Crowdsourcing, a term coined in 2006, is increasingly being employed to fill this gap using a variety of online tools and services, but to be effective, it requires the right survey instrument and a knowledgeable team of professionals to employ it — to create an effective survey, compile and analyze the data and, ideally, to integrate with other professionals and stakeholders to ensure that the knowledge gained by the exercise doesn’t fall between the cracks.
As one firm that has embraced crowdsourcing as part of our broader data-driven efforts, we’re beginning to see applications for this type of approach far beyond what we envisioned when we first developed Sasaki Strategies, a group formalized in 2005 with the goal of creating a strong analytical function to support the firm’s planning and design work. On the heels of many successful deployments in city and campus planning, we’re now bringing crowdsourcing to bear on post-occupancy research, allowing our architects to better understand what aspects of their buildings are operating as they anticipated, and what areas can be improved in future designs. What we’re discovering is that there is no detail too small to be analyzed.
As an example, consider a very typical treatment in contemporary fitness centers. Daylight streams into the space through curtainwall and past a perimeter of fitness equipment, facing out. Designing and outfitting the space in this way simultaneously gives exercisers a dramatic view and animates the building from the outside, and also adheres to CPTED (crime prevention through environmental design) principles, ensuring that exterior pathways and parking lots are “policed” by fitness center users.
This is what an architect would tell you. Do you know what exercisers would tell you? If a large number of users told you that they don’t like exercising in full display of passersby, would that change the way you operated your facility? If you were an architect, would it change your approach to these facilities in the future?
Ask, And You Shall Receive
Sasaki’s internal think tank of programmers and analysts got its official “Strategies” designation about 10 years ago. The group has doubled in size in just the past three years to around nine full-time members, in concert with the development and rollout of its biggest technological breakthrough to date, an online interactive mapping program.
Bearing a flexible name (myCampus in campus planning, myCommunity in municipal and regional planning), each iteration of the program allows survey respondents to drag and drop multiple icons onto a graphic representation of a campus or streetscape and comment at any length about a particular location. Icons sporting different colors and graphics denote different topic areas, so that a viewer can see at a glance where the trouble spots (or favorite spaces) are. Typical icons in a campus planning mode might allow respondents to show areas of the campus where they do or do not feel safe, the routes on which they typically walk or the location of their preferred parking lots.
In one recent use of the tool, respondents at Harvard Kennedy School graphically illustrated for administrators how the campus’ “front door” was underutilized, helping the firm’s planners make the case for a future shift in campus orientation. myCampus is now associated with huge usage numbers on a number of campuses — as of this writing, more than 2,500 respondents at three different universities had each placed more than 40,000 icons on their respective campus maps, and an ongoing planning survey at Rutgers had topped 7,500 respondents.
Adapted for post-occupancy use, the myBuilding tool can include icons for larger-picture input (favorite hangout?) as well as much more granular topics: Too hot/cold; Amenities we wish we had; Room oversized/undersized; Confusing equipment or signage; Long waiting time. As with myCampus, the idea is to avoid tailoring the mapping questions, giving respondents free rein to drop icons wherever they please and add comments, as desired. And comment they do, sometimes at length, with some of the comments helpful for designers (UNDERSIZED: “For fencing, this room is just a little too narrow”) and some for owners (MISSING PIECE: “I wish we had larger mats to work out on. There is only one small mat in the back of the second floor, and it is usually overcrowded”).
After the mapping portion of the survey, respondents add traditional survey information that will offer opportunities to find splits in the data: class, gender, typical visit times, visit frequency, and any number of yes/no questions. In post-occupancy research, for example, we’d expect to always include two vital questions — Did this facility impact your decision to attend/stay at the university? — that can help recreation and university administrators quantify the building’s impact.
In a recent myBuilding post-occupancy survey, we also asked a series of questions for which respondents chose from a list of provided answers and were asked to rank them. How has the recreation center impacted you? In your opinion, what are the most important advantages of the facility’s location? What are the four most important aspects of your routine? For the owner, the goal in asking many of these questions is simply to better understand how people are using the space, with an eye toward better space management and space utilization tactics in the future, which then inform improved capital allocation decisions.
But the potential benefits are even greater, once different data sets are put together. A tool such as MyBuilding and myCampus allows administrators to merge mission-based planning, financial planning and physical planning so that these things that have traditionally been done on separate tracks get to inform one another and lead to better results.
Analyze This
Our adaptation of myCampus to post-occupancy research has come with only one hiccup — while an increasing number of university administrators have shown a willingness to grant access to student contact information when an exciting new construction project is in development, they appear to be less inclined to invite student involvement after a building has been completed. The obvious danger of only authorizing building users, or even a small subset of building users, to take part in a survey is self-selection bias — and in any case, it flies in the face of the very concept of crowdsourcing.
Thus far, faculty, staff and students who have used myBuilding are providing a lot of excitement — facility users enjoy the tool’s interactive and freeform nature — as well as data on facility management and operations that is invaluable to rec center owners. Both users and administrators have a stake in how a building can be programmed to meet demand, or how to bring in fringe groups to get excited about exercise. Respondents are not shy about getting involved and offering their opinions on these and other matters.
In the past, it wasn’t easy to get people excited about filling out surveys, and the data was difficult to compile and massage. Open forums and other face-to-face meetings netted a small amount of information that tended to be skewed, since the tendency was to err on the side of whomever in the room spoke the loudest or most passionately. We still see MyBuilding and myCampus as augmenting these other traditional methods, but it is easy to imagine crowdsourcing methods crowding out other forms of information gathering.
The ability to ask questions of a very large group of people using an interactive tool that gives them free rein to expand on their opinions anonymously sometimes elicits answers, comments, complaints and ideas that we never anticipated. Simply by asking general questions about how people use a particular space, we sometimes learn something really surprising that can inform us going forward. §
About the Author
Chris Sgarzi (csgarzi@sasaki.com) is a principal and leader of the sports practice at Sasaki Associates Inc. in Watertown, Mass.
Related Stories
| Mar 2, 2011
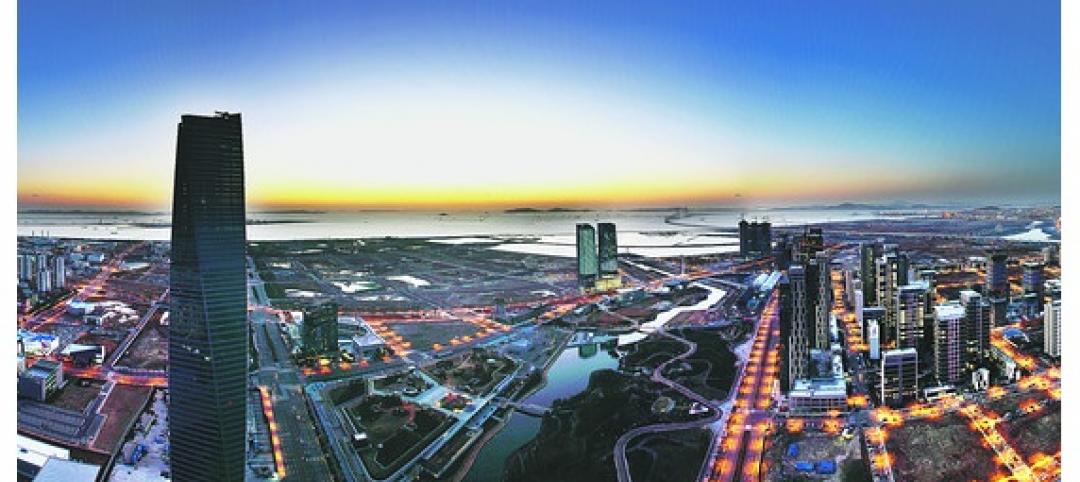
Cities of the sky
According to The Wall Street Journal, the Silk Road of the future—from Dubai to Chongqing to Honduras—is taking shape in urban developments based on airport hubs. Welcome to the world of the 'aerotropolis.'
| Mar 2, 2011
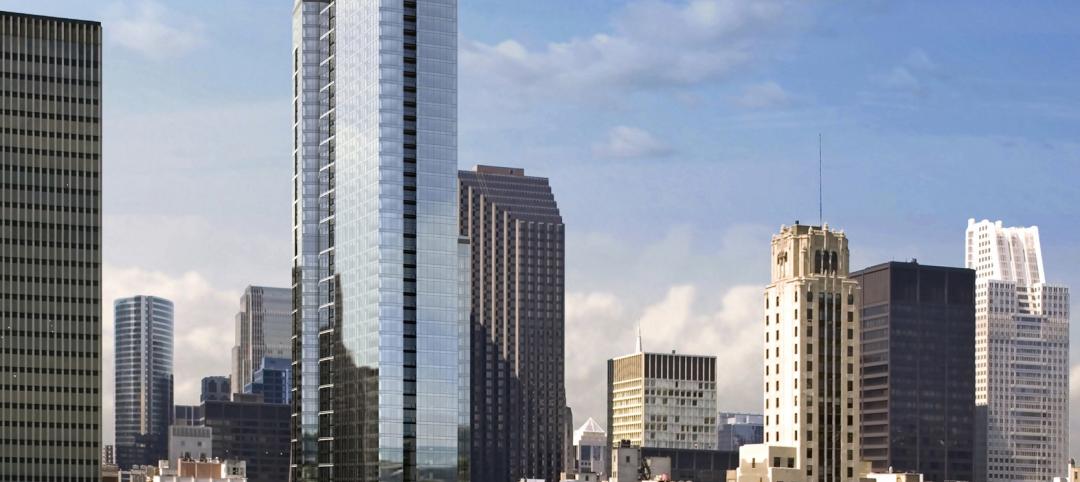
How skyscrapers can save the city
Besides making cities more affordable and architecturally interesting, tall buildings are greener than sprawl, and they foster social capital and creativity. Yet some urban planners and preservationists seem to have a misplaced fear of heights that yields damaging restrictions on how tall a building can be. From New York to Paris to Mumbai, there’s a powerful case for building up, not out.
| Mar 1, 2011
Smart cities: getting greener and making money doing it
The Global Green Cities of the 21st Century conference in San Francisco is filled with mayors, architects, academics, consultants, and financial types all struggling to understand the process of building smarter, greener cities on a scale that's practically unimaginable—and make money doing it.
| Mar 1, 2011
How to make rentals more attractive as the American dream evolves, adapts
Roger K. Lewis, architect and professor emeritus of architecture at the University of Maryland, writes in the Washington Post about the rising market demand for rental housing and how Building Teams can make these properties a desirable choice for consumer, not just an economically prudent and necessary one.
| Mar 1, 2011
New survey shows shifts in hospital construction projects
America’s hospitals and health systems are focusing more on renovation or expansion than new construction, according to a new survey conducted by Health Facilities Management magazine and the American Society for Healthcare Engineering (ASHE). In fact, renovation or expansion accounted for 73% of construction projects at hospitals responding to the survey.
| Mar 1, 2011
AIA selects 6 communities for long-term sustainability program
The American Institute of Architects today announced it has selected 6 communities throughout the country to receive technical assistance under the Sustainable Design Assessment Team (SDAT) program in 2011. The communities selected are Shelburne, Vt., Apple Valley, Mn., Pikes Peak Region, Co., Southwest DeKalb County, Ga., Bastrop, Tx., and Santa Rosa, Ca. The SDAT program represents a significant institutional investment by the AIA in public service work to assist communities in developing policy frameworks and long term sustainability plans.
| Feb 24, 2011
Perkins+Will designs 100 LEED Certified buildings
Perkins+Will announced the Leadership in Energy and Environmental Design (LEED) certification of its 100th sustainable building, marking a key milestone for the firm and for the sustainable design industry. The Vancouver-based Dockside Green Phase Two Balance project marks the firm’s 100th LEED certified building and is tied for the highest scoring LEED building worldwide with its sister project, Dockside Green Phase One.
| Feb 24, 2011
New reports chart path to net-zero-energy commercial buildings
Two new reports from the Zero Energy Commercial Buildings Consortium (CBC) on achieving net-zero-energy use in commercial buildings say that high levels of energy efficiency are the first, largest, and most important step on the way to net-zero.
| Feb 24, 2011
Lending revives stalled projects
An influx of fresh capital into U.S. commercial real estate is bringing some long-stalled development projects back to life and launching new construction of apartments, office buildings and shopping centers, according to a Wall Street Journal article.
| Feb 23, 2011
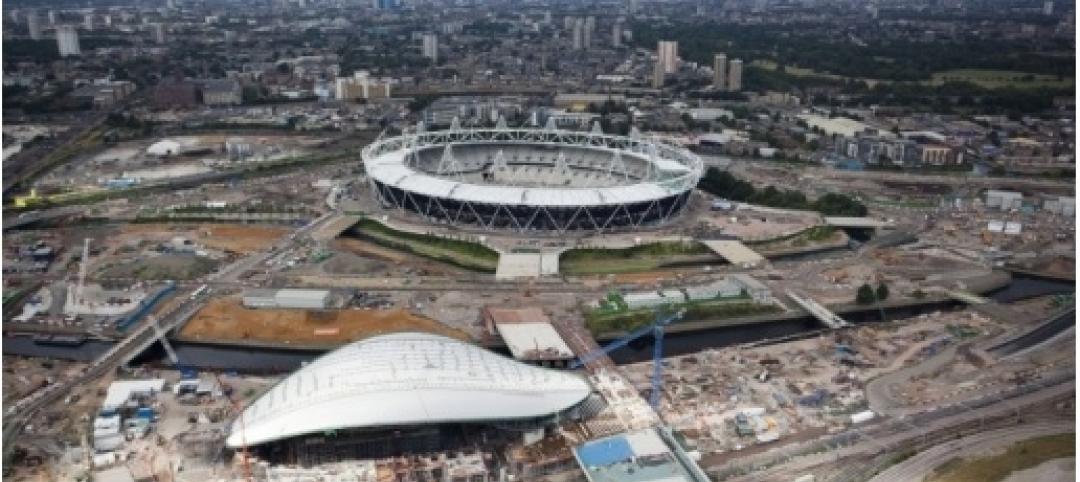
London 2012: What Olympic Park looks like today
London 2012 released a series of aerial images that show progress at Olympic Park, including a completed roof on the stadium (where seats are already installed), tile work at the aquatic centre, and structural work complete on more than a quarter of residential projects at Olympic Village.


