

Associated Builders and Contractors (ABC) today reported that its Construction Backlog Indicator(CBI) expanded to 9.67 months during the fourth quarter of 2017—its highest level ever and a 2.25% increase from the prior quarter. Backlog records were broken in the Northeast region, the commercial/industrial segment and among firms with $30 to $50 million in annual revenues. CBI is up by 1.36 months, or 16.3%, on a year-over-year basis.

“During the fourth quarter of 2017, the CBI established an all-time high, breaking records set during both the first and third quarters of last year,” said ABC Chief Economist Anirban Basu. “The implication is that the average nonresidential construction firm entered 2018 with significant momentum. Construction spending is set to be elevated this year under virtually any conceivable scenario.
“A confluence of factors has produced this result, including still-expansionary monetary policy and accelerating global growth in much of the world, brisk foreign investment in U.S. commercial real estate, surging business/developer confidence, deregulation of certain key industries, higher energy prices, strong consumer spending, a recovering U.S. manufacturing sector and rising spending in a handful of publicly financed construction categories,” said Basu. “Recently enacted tax reform is likely to serve as an additional tailwind to an already strong construction story.
“As always, there is reason for some concern. While 2018 is likely to be a solid year for construction spending, there are grey clouds emerging from the silver linings. A trade dispute with Canada has helped push softwood lumber prices higher. Recently announced tariffs on steel and aluminum may have similar effects. Indeed, inflationary pressures are building in various elements of the economy, including wages, health care, homes, apartments and tuition. The result is an increasingly inflationary economy likely to produce higher interest rates over time,” said Basu. “Should interest rates rise too quickly, backlog is likely to eventually decline as fewer developments are green-lighted due to higher borrowing costs.”

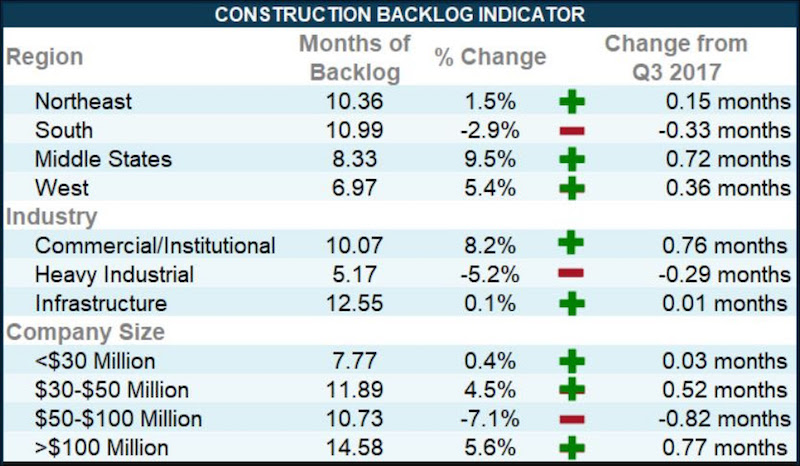
Highlights by Region
Backlog in the South fell 2.9% during the fourth quarter, but remains nearly 15%higher on a year-over-year basis. Southern markets such as Orlando, Atlanta, Nashville, Dallas and Austin continue to be associated with significant construction momentum. The storms of several months ago also have helped lift backlog in Houston and other impacted communities.
Backlog in the Northeast expanded for a fifth consecutive quarter as cities like Boston, New York and Philadelphia continue to experience brisk commercial investment. The region’s backlog has expanded by nearly 23% during the past year and now stands at its highest recorded level.
Backlog in the Middle States rebounded during the fourth quarter after declining during the prior two quarters. The 9.5% quarterly increase represented the largest quarterly increase in any of the four regions.
Backlog in the West continued to rise during the fourth quarter, but still stands at just 7 months. The 2017 California wildfire season, which was the most destructive on record and burned nearly 1.4 million acres, likely stalled a certain volume of construction projects and suppressed fourth quarter backlog.
Highlights by Industry
Backlog in the commercial/institutional segment expanded briskly for a second consecutive quarter. At 10.1 months, the segment’s average backlog is at its highest level in the history of the series.
Average backlog in the heavy industrial category fell for a third consecutive quarter. At 5.2 months, the segment’s backlog is down 5.2% on a quarterly basis and 5.8% on a year-over-year basis. CBI has neatly predicted recently observed declines in construction activity related to U.S. manufacturing.
Backlog in the infrastructure category inched up to 12.55 months during the fourth quarter, the highest reading on record for the segment. Improving state and local government finances are helping spur additional public construction, including in the education, public safety, highway/street and transportation categories.
Highlights by Company Size
Large firms, those with annual revenues in excess of $100 million, have experienced skyrocketing backlog during the past year. The combination of large-scale commercial/mixed-use development and stepped up public construction activity has produced an average backlog approaching 14.6 months. Backlog for the nation’s largest nonresidential construction firms is up an astonishing 35% during the past year.
Backlog among firms with annual revenues between $50 million and $100 million fell by 0.8 months in the fourth quarter and currently stands at a still-healthy 10.73 months. Backlog for this category is at its second highest level since the late stages of 2013.
Firms with $30 million to $50 million in annual revenues experienced their fifth consecutive quarter of rising backlog. The fourth quarter reading of 11.89 months surpasses the third quarter of 2012 as the highest on record.
Backlog for firms with annual revenues below $30 million increased by 0.4% during the fourth quarter and remains remarkable steady. For the past three years, backlog for this category has remained in a tight range between 7.2 months and 8.1 months. It is conceivable that the lack of pronounced growth in backlog for this group is due to a lack of available workforce. The lack of a reliably available workforce renders it difficult for smaller firms to commit to the larger-scale projects that would pump up backlog.

CBI is a leading economic indicator that reflects the amount of construction work under contract, but not yet completed. CBI is measured in months, with a lengthening backlog implying expanding demand for construction services. More CBI charts and graphs are available on abc.org.
Related Stories

Market Data | Feb 4, 2016
Mortenson: Nonresidential construction costs expected to increase in six major metros
The Construction Cost Index, from Mortenson Construction, indicated rises between 3 and 4% on average.

Contractors | Feb 1, 2016
ABC: Tepid GDP growth a sign construction spending may sputter
Though the economy did not have a strong ending to 2015, the data does not suggest that nonresidential construction spending is set to decline.

Data Centers | Jan 28, 2016
Top 10 markets for data center construction
JLL’s latest outlook foresees a maturation in certain metros.

Market Data | Jan 20, 2016
Nonresidential building starts sag in 2015
CDM Research finds only a few positive signs among the leading sectors.
Market Data | Jan 20, 2016
Architecture Billings Index ends year on positive note
While volatility persists, architecture firms reported healthy performance for 2015.

Market Data | Jan 15, 2016
ABC: Construction material prices continue free fall in December
In December, construction material prices fell for the sixth consecutive month. Prices have declined 7.2% since peaking in August 2014.

Market Data | Jan 13, 2016
Morgan Stanley bucks gloom and doom, thinks U.S. economy has legs through 2020
Strong job growth and dwindling consumer debt give rise to hope.

Hotel Facilities | Jan 13, 2016
Hotel construction should remain strong through 2017
More than 100,000 rooms could be delivered this year alone.

Market Data | Jan 6, 2016
Census Bureau revises 10 years’ worth of construction spending figures
The largest revisions came in the last two years and were largely upward.

Market Data | Jan 5, 2016
Majority of AEC firms saw growth in 2015, remain optimistic for 2016: BD+C survey
By all indications, 2015 was another solid year for U.S. architecture, engineering, and construction firms.


