


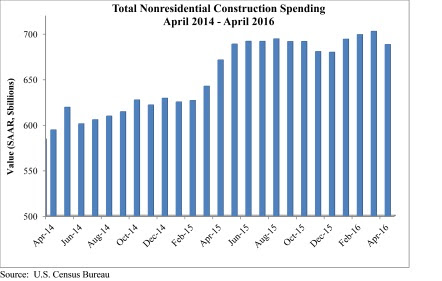
Nonresidential construction spending fell 2.1% in April according to analysis of U.S. Census Bureau data released by Associated Builders and Contractors (ABC). Nonresidential spending totaled $688.2 billion on a seasonally adjusted, annualized rate.
Much like last month, the sting of a disappointing headline number was mitigated by upward revisions to the previous two months of data. March's estimate was revised from $695.7 billion to $702.6 billion, while February's estimate saw a 0.1% increase. March represents the first month in which spending exceeded $700 billion since March 2009.
"Nonresidential construction spending growth continues to struggle to maintain momentum," said ABC Chief Economist Anirban Basu. "The amount of nonresidential construction value put in place has expanded by just 2.5% over the past year, with private spending up 3.4% and public spending up just 1.4%. While many will primarily attribute this to a sluggish U.S. economy, one that has expanded by less than 1.5% during each of the last two completed calendar quarters, there are other factors at work.
"Lower materials prices are embodied in the value of completed work," said Basu. "Though commodity prices have been firming recently, commodity prices had been in decline for more than a year. Moreover, in some communities, nonresidential construction is facing severe constraints given an insufficient number of qualified workers. Both factors would tend to constrain the level of observed growth in nonresidential construction spending.
"There may also be growing skittishness among private developers, who have become increasingly concerned by possible overbuilding in commercial, office and lodging markets," warned Basu. "Both lodging and commercial construction spending dipped in April. This hesitancy is reflected in many ways, including in the Architectural Billings Index, which has struggled to consistently stand meaningfully above its threshold value of 50. Public spending also remains lackluster as many states deal with underfunded pensions and ballooning Medicaid costs."
Only five of 16 nonresidential construction sectors experienced spending increases in April on a monthly basis:
- Religious-related spending expanded 9.6% from March 2016 and 7.3% from April 2015.
- Spending in the public safety category grew 5.2% on a monthly basis but fell 6.2% on a yearly basis.
- Office-related spending expanded 1.6% for the month and 20.3% for the year.
- Amusement and recreation-related spending expanded 0.8% month-over-month and 8.3% year-over-year.
- Spending in the power category rose by 0.3% for the month and 0.6% from April 2015.
Spending in 11 of the nonresidential construction subsectors fell in April on a monthly basis:
- Spending in the communication category fell 7.7% from March 2016 and is down 16.4% from April 2015.
- Highway and street-related spending fell 6.5% on a monthly basis but is up 4% on a yearly basis.
- Commercial-related spending dipped 3.7% for the month but is up 6.8% from April 2015.
- Spending in the health care category fell 3% from March 2016 and is down 0.6% from the same month one year ago.
- Educational-related spending dropped 2.4% month-over-month but is up 5.4% year-over-year.
- Spending in the lodging category fell 2% on a monthly basis but is up 24.6% on a yearly basis.
- Transportation-related spending fell 1.7% since March 2016 and is down 1% from April 2015.
- Sewage and waste disposal-related spending fell 1.4% for the month but is up 1% from April 2015.
- Manufacturing-related spending fell 1.4% month-over-month and 9.8% year-over-year.
- Spending in the conservation and development category dipped 1.2% for the month and 6.5% year-over-year.
- Water supply-related spending fell 0.5% on a monthly basis and 6.5% on a yearly basis.
Related Stories

Market Data | Nov 6, 2018
Unflagging national office market enjoys economic tailwinds
Stable vacancy helped push asking rents 4% higher in third quarter.
Market Data | Nov 2, 2018
Nonresidential spending retains momentum in September, up 8.9% year over year
Total nonresidential spending stood at $767.1 billion on a seasonally adjusted, annualized rate in September.

Market Data | Oct 30, 2018
Construction projects planned and ongoing by world’s megacities valued at $4.2trn
The report states that Dubai tops the list with total project values amounting to US$374.2bn.
Market Data | Oct 26, 2018
Nonresidential fixed investment returns to earth in Q3
Despite the broader economic growth, fixed investment inched 0.3% lower in the third quarter.

Market Data | Oct 24, 2018
Architecture firm billings slow but remain positive in September
Billings growth slows but is stable across sectors.

Market Data | Oct 19, 2018
New York’s five-year construction spending boom could be slowing over the next two years
Nonresidential building could still add more than 90 million sf through 2020.

Market Data | Oct 8, 2018
Global construction set to rise to US$12.9 trillion by 2022, driven by Asia Pacific, Africa and the Middle East
The pace of global construction growth is set to improve slightly to 3.7% between 2019 and 2020.
Market Data | Sep 25, 2018
Contractors remain upbeat in Q2, according to ABC’s latest Construction Confidence Index
More than three in four construction firms expect that sales will continue to rise over the next six months, while three in five expect higher profit margins.

Market Data | Sep 24, 2018
Hotel construction pipeline reaches record highs
There are 5,988 projects/1,133,017 rooms currently under construction worldwide.
Market Data | Sep 21, 2018
JLL fit out report portrays a hot but tenant-favorable office market
This year’s analysis draws from 2,800 projects.


