


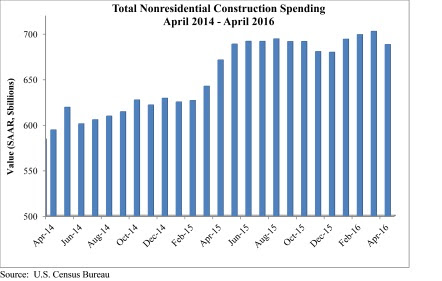
Nonresidential construction spending fell 2.1% in April according to analysis of U.S. Census Bureau data released by Associated Builders and Contractors (ABC). Nonresidential spending totaled $688.2 billion on a seasonally adjusted, annualized rate.
Much like last month, the sting of a disappointing headline number was mitigated by upward revisions to the previous two months of data. March's estimate was revised from $695.7 billion to $702.6 billion, while February's estimate saw a 0.1% increase. March represents the first month in which spending exceeded $700 billion since March 2009.
"Nonresidential construction spending growth continues to struggle to maintain momentum," said ABC Chief Economist Anirban Basu. "The amount of nonresidential construction value put in place has expanded by just 2.5% over the past year, with private spending up 3.4% and public spending up just 1.4%. While many will primarily attribute this to a sluggish U.S. economy, one that has expanded by less than 1.5% during each of the last two completed calendar quarters, there are other factors at work.
"Lower materials prices are embodied in the value of completed work," said Basu. "Though commodity prices have been firming recently, commodity prices had been in decline for more than a year. Moreover, in some communities, nonresidential construction is facing severe constraints given an insufficient number of qualified workers. Both factors would tend to constrain the level of observed growth in nonresidential construction spending.
"There may also be growing skittishness among private developers, who have become increasingly concerned by possible overbuilding in commercial, office and lodging markets," warned Basu. "Both lodging and commercial construction spending dipped in April. This hesitancy is reflected in many ways, including in the Architectural Billings Index, which has struggled to consistently stand meaningfully above its threshold value of 50. Public spending also remains lackluster as many states deal with underfunded pensions and ballooning Medicaid costs."
Only five of 16 nonresidential construction sectors experienced spending increases in April on a monthly basis:
- Religious-related spending expanded 9.6% from March 2016 and 7.3% from April 2015.
- Spending in the public safety category grew 5.2% on a monthly basis but fell 6.2% on a yearly basis.
- Office-related spending expanded 1.6% for the month and 20.3% for the year.
- Amusement and recreation-related spending expanded 0.8% month-over-month and 8.3% year-over-year.
- Spending in the power category rose by 0.3% for the month and 0.6% from April 2015.
Spending in 11 of the nonresidential construction subsectors fell in April on a monthly basis:
- Spending in the communication category fell 7.7% from March 2016 and is down 16.4% from April 2015.
- Highway and street-related spending fell 6.5% on a monthly basis but is up 4% on a yearly basis.
- Commercial-related spending dipped 3.7% for the month but is up 6.8% from April 2015.
- Spending in the health care category fell 3% from March 2016 and is down 0.6% from the same month one year ago.
- Educational-related spending dropped 2.4% month-over-month but is up 5.4% year-over-year.
- Spending in the lodging category fell 2% on a monthly basis but is up 24.6% on a yearly basis.
- Transportation-related spending fell 1.7% since March 2016 and is down 1% from April 2015.
- Sewage and waste disposal-related spending fell 1.4% for the month but is up 1% from April 2015.
- Manufacturing-related spending fell 1.4% month-over-month and 9.8% year-over-year.
- Spending in the conservation and development category dipped 1.2% for the month and 6.5% year-over-year.
- Water supply-related spending fell 0.5% on a monthly basis and 6.5% on a yearly basis.
Related Stories

Market Data | Jan 16, 2019
AIA 2019 Consensus Forecast: Nonresidential construction spending to rise 4.4%
The education, public safety, and office sectors will lead the growth areas this year, but AIA's Kermit Baker offers a cautious outlook for 2020.

Market Data | Dec 19, 2018
Brokers look forward to a commercial real estate market that mirrors 2018’s solid results
Respondents to a recent Transwestern poll expect flat to modest growth for rents and investment in offices, MOBs, and industrial buildings.

Market Data | Dec 19, 2018
When it comes to economic clout, New York will far outpace other U.S. metros for decades to come
But San Jose, Calif., is expected to have the best annual growth rate through 2035, according to Oxford Economics’ latest Global Cities report.

Market Data | Dec 19, 2018
Run of positive billings continues at architecture firms
November marked the fourteenth consecutive month of increasing demand for architectural firm services.

Market Data | Dec 5, 2018
ABC predicts construction sector will remain strong in 2019
Job growth, high backlog and healthy infrastructure investment all spell good news for the industry.
Market Data | Dec 4, 2018
Nonresidential spending rises modestly in October
Thirteen out of 16 subsectors are associated with year-over-year increases.
Market Data | Nov 20, 2018
Construction employment rises from October 2017 to October 2018 in 44 states and D.C.
Texas has biggest annual job increase while New Jersey continues losses; Iowa, Florida and California have largest one-month gains as Mississippi and Louisiana trail.

Market Data | Nov 15, 2018
Architecture firm billings continue to slow, but remain positive in October
Southern region reports decline in billings for the first time since June 2012.
Market Data | Nov 14, 2018
A new Joint Center report finds aging Americans less prepared to afford housing
The study foresees a significant segment of seniors struggling to buy or rent on their own or with other people.

Market Data | Nov 12, 2018
Leading hotel markets in the U.S. construction pipeline
Projects already under construction and those scheduled to start construction in the next 12 months, combined, have a total of 3,782 projects/213,798 rooms and are at cyclical highs.


