


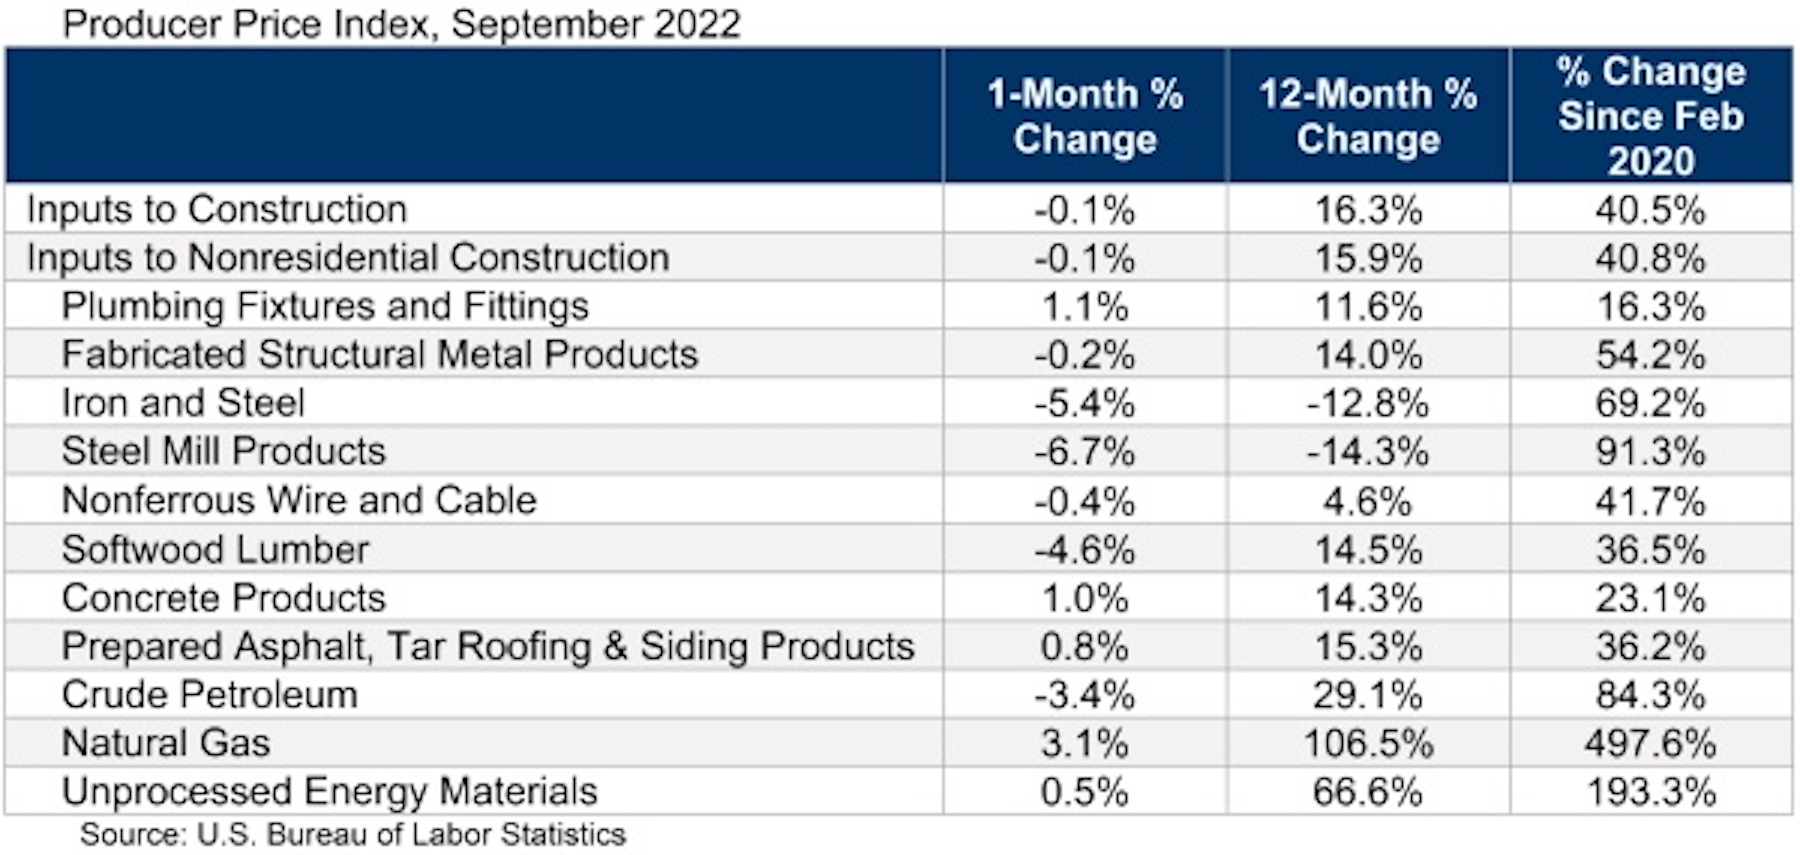
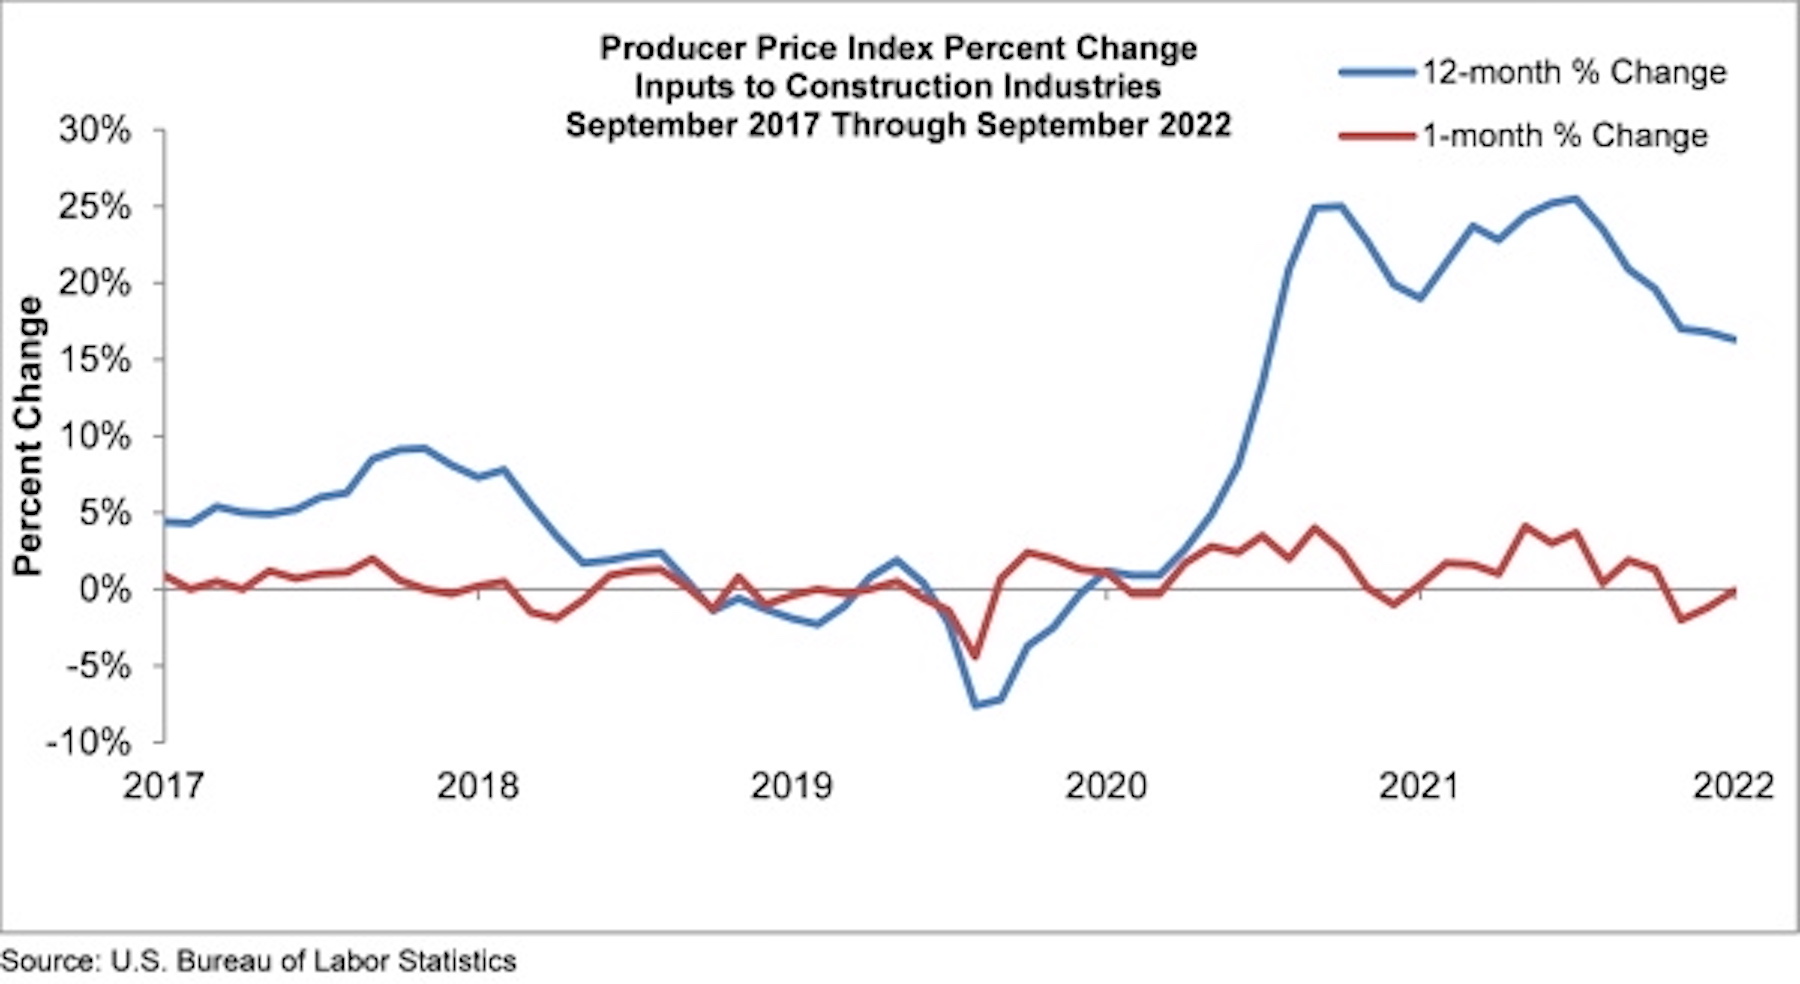
Construction input prices dipped 0.1% in September compared to the previous month, according to an Associated Builders and Contractors analysis of U.S. Bureau of Labor Statistics’ Producer Price Index data released today. Nonresidential construction input prices also fell 0.1% for the month.
Construction input prices are up 16.3% from a year ago, while nonresidential construction input prices are 15.9% higher. Input prices were down in six of 11 subcategories on a monthly basis. Steel mill prices fell 6.7% and iron and steel prices dropped 5.4%. Natural gas prices rose 3.1%, while crude petroleum prices were down 3.4% in September. Overall producer prices expanded 0.4% in September, a larger increase than the consensus estimate of 0.2%.
“Investors and other stakeholders are eagerly awaiting any indications of meaningful declines in inflationary pressures,” said ABC Chief Economist Anirban Basu. “Elevated inflation and interest rate increases have not only undone momentum in America’s homebuilding industry but also threaten the entire global economy. There are already indications of growing financial stress, including at banking giant Credit Suisse. This is bad news for the heavily financed real estate and construction segments.
“While many American nonresidential contractors remain upbeat, according to ABC’s Construction Confidence Index, there are significant threats looming over the industry,” said Basu. “Next year stands to be a weak one for the U.S. economy as it continues to absorb the impacts of rapidly rising borrowing costs.
“Today’s PPI release strongly suggests that there is no impending end to the Federal Reserve’s rate-tightening, which means that negative factors threatening the broader economy and nonresidential construction are only getting stronger,” said Basu. “While nonresidential input prices fell slightly, inflation came in hotter than anticipated in the overall report. For contractors, the upshot is that they should be actively preparing their respective balance sheets for a downturn, even as many firms presently operate at capacity.”
Related Stories

Market Data | Mar 29, 2017
Contractor confidence ends 2016 down but still in positive territory
Although all three diffusion indices in the survey fell by more than five points they remain well above the threshold of 50, which signals that construction activity will continue to be one of the few significant drivers of economic growth.

Market Data | Mar 24, 2017
These are the most and least innovative states for 2017
Connecticut, Virginia, and Maryland are all in the top 10 most innovative states, but none of them were able to claim the number one spot.

Market Data | Mar 22, 2017
After a strong year, construction industry anxious about Washington’s proposed policy shifts
Impacts on labor and materials costs at issue, according to latest JLL report.

Market Data | Mar 22, 2017
Architecture Billings Index rebounds into positive territory
Business conditions projected to solidify moving into the spring and summer.

Market Data | Mar 15, 2017
ABC's Construction Backlog Indicator fell to end 2016
Contractors in each segment surveyed all saw lower backlog during the fourth quarter, with firms in the heavy industrial segment experiencing the largest drop.

Market Data | Feb 28, 2017
Leopardo’s 2017 Construction Economics Report shows year-over-year construction spending increase of 4.2%
The pace of growth was slower than in 2015, however.

Market Data | Feb 23, 2017
Entering 2017, architecture billings slip modestly
Despite minor slowdown in overall billings, commercial/ industrial and institutional sectors post strongest gains in over 12 months.

Market Data | Feb 16, 2017
How does your hospital stack up? Grumman/Butkus Associates 2016 Hospital Benchmarking Survey
Report examines electricity, fossil fuel, water/sewer, and carbon footprint.

Market Data | Feb 1, 2017
Nonresidential spending falters slightly to end 2016
Nonresidential spending decreased from $713.1 billion in November to $708.2 billion in December.

Market Data | Jan 31, 2017
AIA foresees nonres building spending increasing, but at a slower pace than in 2016
Expects another double-digit growth year for office construction, but a more modest uptick for health-related building.


