


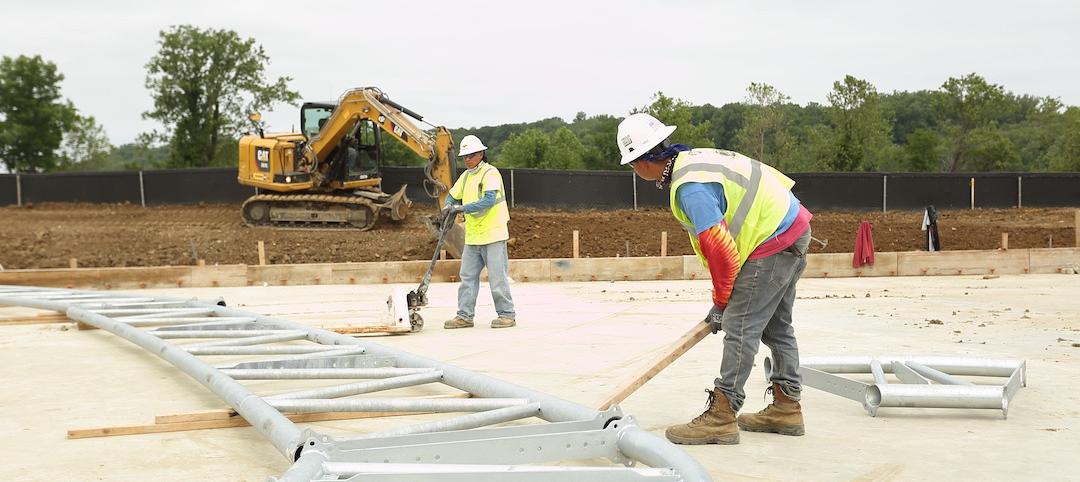
NAIOP, the Commercial Real Estate Development Association, recently released its annual study “Economic Impacts of Commercial Real Estate” in which it details the development, construction, and ongoing operations of new commercial real estate in the U.S.
The study shows office, industrial, warehouse, and retail real estate development supported 6.25 million American jobs and contributed $861 billion to U.S. GDP in 2016. Between 2011 and October 2016, construction spending increased 48.7% and was a key factor in the economy’s growth in 2016. For the year ending in October 2016, total construction spending was up 3.4%.
Office and Warehouse spending increased by 28.7% and 12.7% respectively from 2015. Retail spending decreased 7 percent from gains of 8.2% in 2015. Industrial spending decreased significantly for the second straight year, down 29.9% from 2015.
Of the top 10 states by construction value (office, industrial, warehouse, and retail), only three (New York, Texas, and Florida) remained in the same position as 2015. New York was once again first on the list with $24.8 billion in direct spending and $46.05 billion in total output. Texas wasn’t far behind with $18.5 billion in direct spending and $44.3 billion in total output. Florida once again took the fifth position on the list.

To view the full report, click here.
Related Stories

Market Data | Oct 19, 2021
Demand for design services continues to increase
The Architecture Billings Index (ABI) score for September was 56.6.
Market Data | Oct 14, 2021
Climate-related risk could be a major headwind for real estate investment
A new trends report from PwC and ULI picks Nashville as the top metro for CRE prospects.
Market Data | Oct 14, 2021
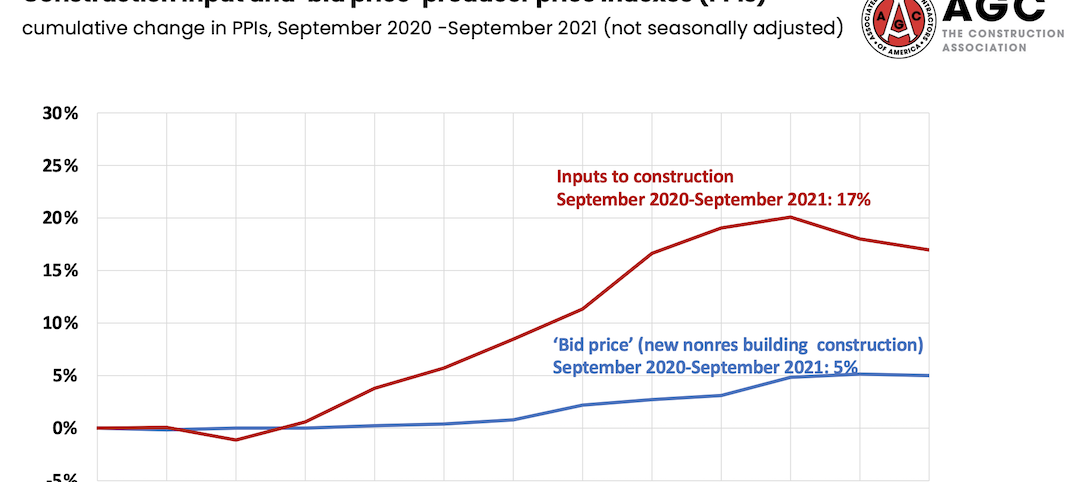
Prices for construction materials continue to outstrip bid prices over 12 months
Construction officials renew push for immediate removal of tariffs on key construction materials.
Market Data | Oct 11, 2021
No decline in construction costs in sight
Construction cost gains are occurring at a time when nonresidential construction spending was down by 9.5 percent for the 12 months through July 2021.
Market Data | Oct 11, 2021
Nonresidential construction sector posts first job gain since March
Has yet to hit pre-pandemic levels amid supply chain disruptions and delays.
Market Data | Oct 4, 2021
Construction spending stalls between July and August
A decrease in nonresidential projects negates ongoing growth in residential work.
Market Data | Oct 1, 2021
Nonresidential construction spending dips in August
Spending declined on a monthly basis in 10 of the 16 nonresidential subcategories.
Market Data | Sep 29, 2021
One-third of metro areas lost construction jobs between August 2020 and 2021
Lawrence-Methuen Town-Salem, Mass. and San Diego-Carlsbad, Calif. top lists of metros with year-over-year employment increases.
Market Data | Sep 28, 2021
Design-Build projects should continue to take bigger shares of construction spending pie over next five years
FMI’s new study finds collaboration and creativity are major reasons why owners and AEC firms prefer this delivery method.
Market Data | Sep 22, 2021
Architecture billings continue to increase
The ABI score for August was 55.6, up from July’s score of 54.6.


