

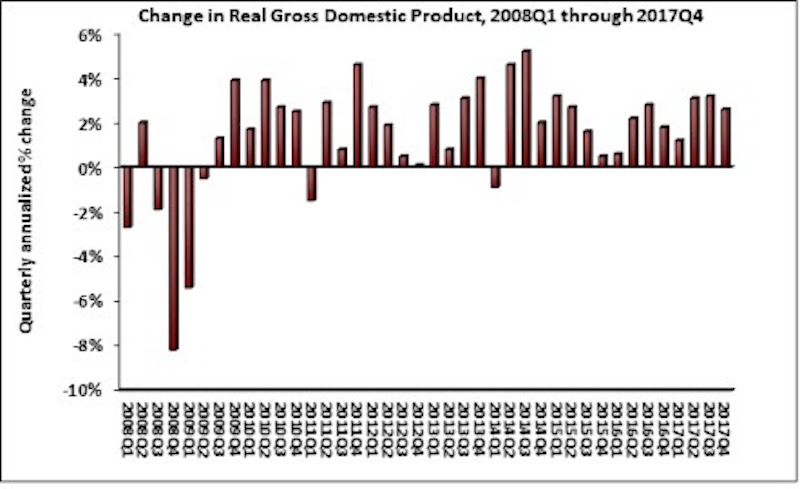
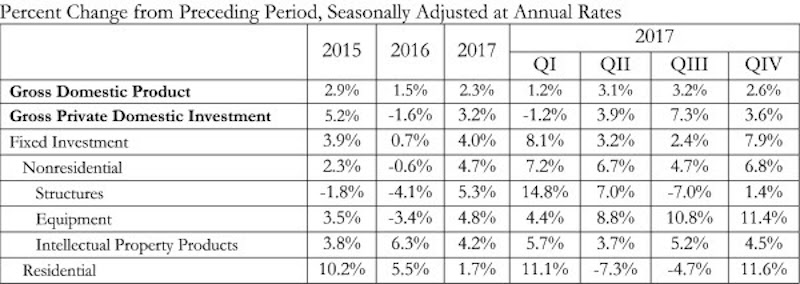
The U.S. economy grew by 2.3% in 2017, while fixed investment increased at a annual rate of 7.9%, according to an Associated Builders and Contractors (ABC) analysis of data released today by the Bureau of Economic Analysis.
The economy expanded at an annual rate of 2.6% during the fourth quarter of 2017 after expanding at a 3.2% rate during the third quarter. Nonresidential fixed investment performed similarly to overall fixed investment in the fourth quarter by increasing at a 6.8% rate. This represents the third time in the past four quarters that nonresidential fixed investment increased by at least 6.7%.
The year-end figure for GDP growth of 2.3% is up from 1.5% in 2016 but down from the 2.9% figure posted in 2015. Nonresidential fixed investment increased 4.7% in 2017, its best year since increasing 6.9% in 2014. This followed a 0.6% contraction in 2016.
“Many will look at this report and conclude that consumer spending, the largest component of the economy, drove fourth quarter growth by expanding at a 3.8% annual rate,” said ABC Chief Economist Anirban Basu. “Upon further inspection, however, the fourth quarter consumer spending missed its 3% expectation due to imports increasing at twice the rate of exports. This widening trade deficit subtracted 1.13 percentage points from fourth quarter GDP growth.
“The factors that have helped to accelerate economic growth in America remain in place, including a strengthening global economy, abundant consumer and business confidence, elevated liquidity flowing through the veins of the international financial system and deregulation,” said Basu. “Stakeholders should be aware that although many companies have announced big plans for stepped-up investment, staffing and compensation—due at least in part to the recently enacted tax cut—the plans have yet to fully manifest within the data. The implication is that the U.S. economy is set to roar in 2018.
“As always, contractors are warned to remain wary,” said Basu. “The combination of extraordinary confidence and capital can fuel excess financial leverage and spur asset price bubbles. The implication is that as contractors remain busy, there should be an ongoing stockpiling of defensive cash. That recommendation will be difficult for many contractors to implement, however, with labor shortages and materials costs rising more rapidly and slender profit margins in many construction segments.”

Related Stories

Market Data | Apr 6, 2017
Architecture marketing: 5 tools to measure success
We’ve identified five architecture marketing tools that will help your firm evaluate if it’s on the track to more leads, higher growth, and broader brand visibility.

Market Data | Apr 3, 2017
Public nonresidential construction spending rebounds; overall spending unchanged in February
The segment totaled $701.9 billion on a seasonally adjusted annualized rate for the month, marking the seventh consecutive month in which nonresidential spending sat above the $700 billion threshold.

Market Data | Mar 29, 2017
Contractor confidence ends 2016 down but still in positive territory
Although all three diffusion indices in the survey fell by more than five points they remain well above the threshold of 50, which signals that construction activity will continue to be one of the few significant drivers of economic growth.

Market Data | Mar 24, 2017
These are the most and least innovative states for 2017
Connecticut, Virginia, and Maryland are all in the top 10 most innovative states, but none of them were able to claim the number one spot.

Market Data | Mar 22, 2017
After a strong year, construction industry anxious about Washington’s proposed policy shifts
Impacts on labor and materials costs at issue, according to latest JLL report.

Market Data | Mar 22, 2017
Architecture Billings Index rebounds into positive territory
Business conditions projected to solidify moving into the spring and summer.

Market Data | Mar 15, 2017
ABC's Construction Backlog Indicator fell to end 2016
Contractors in each segment surveyed all saw lower backlog during the fourth quarter, with firms in the heavy industrial segment experiencing the largest drop.

Market Data | Feb 28, 2017
Leopardo’s 2017 Construction Economics Report shows year-over-year construction spending increase of 4.2%
The pace of growth was slower than in 2015, however.

Market Data | Feb 23, 2017
Entering 2017, architecture billings slip modestly
Despite minor slowdown in overall billings, commercial/ industrial and institutional sectors post strongest gains in over 12 months.

Market Data | Feb 16, 2017
How does your hospital stack up? Grumman/Butkus Associates 2016 Hospital Benchmarking Survey
Report examines electricity, fossil fuel, water/sewer, and carbon footprint.


