


At the end of the first quarter of 2020, analysts at Lodging Econometrics (LE) report that the total U.S. construction pipeline continued to expand year-over-year (YOY) to 5,731 projects/706,128 rooms, up 1% by projects and 3% by rooms. However, quarter-over-quarter, the pipeline has contracted slightly less than 1% by both project and room counts, down from 5,748 projects/708,898 rooms at the close of 2019.
Projects currently under construction stand at an all-time high of 1,819 projects/243,100 rooms. Projects scheduled to start construction in the next 12 months total 2,284 projects/264,286 rooms, while projects in the early planning stage stand at 1,628 projects/198,742 rooms. Projects in the early planning stage are up 8% by projects and 11% by rooms, YOY. Developers with projects under construction have generally extended their opening dates by two to four months. For projects scheduled to start construction in the next 12 months, on average, developers have adjusted their construction start and opening dates outwards by four to six months. Additionally, brands have been empathetic with developers by relaxing timelines as everyone adjusts to the COVID-19 interruptions. As a result, LE anticipates a stronger count of openings in the second half of 2020, compared to the first half.
In the first quarter of 2020, the U.S. opened 144 new hotels with 16,305 rooms. While the COVID-19 pandemic has slowed development, it has not completely stalled it. There were still 312 new projects with 36,464 rooms announced into the pipeline in the first quarter.
Many open or temporarily closed hotels have already begun or are in the planning stages of renovating and repositioning their assets while occupancy is low or non-existent. At the close of the first quarter, LE recorded 769 active renovation projects/163,030 rooms and 616 active conversion projects/69,258 rooms throughout the United States.
To date, the largest fiscal relief and stimulus efforts include the unprecedented $2 trillion CARES Act, the Paycheck Protection Program (PPP), and the Paycheck Protection Program Liquidity Facility (PPPLF), with a third phase of relief having been signed by the president last week. This third phase includes nearly $500 billion to further support the small-business loan program, as well as provide additional critical funding needed for hospitals and comprehensive testing. A phase four “CARES Act 2” package is already being discussed.
In order to support the economy and build liquidity, the Federal Reserve cut interest rates to almost zero; reduced bank reserve requirements to zero; rapidly purchased hundreds of billions of dollars in treasury bonds and mortgage-backed securities; bought corporate and municipal debt; and extended emergency credit to non-banks. The Federal Reserve has signaled that it will provide more support to the economy if warranted.
Although there are discussions about opening parts of the country that are beginning to stabilize; it will be measured with phased openings designed to effectively balance a highly desired economic ramp up while following prudent health and safety precautions.
*COVID-19 (coronavirus) did not have a full impact on first quarter 2020 U.S. results reported by LE. Only the last 30 days of the quarter were affected. LE’s market intelligence department has and will continue to gather the necessary global intelligence on the supply side of the lodging industry and make that information available to our subscribers. It is still early to predict the full impact of the outbreak on the lodging industry. We will have more information to report in the coming months.
Related Stories

Market Data | Sep 10, 2019
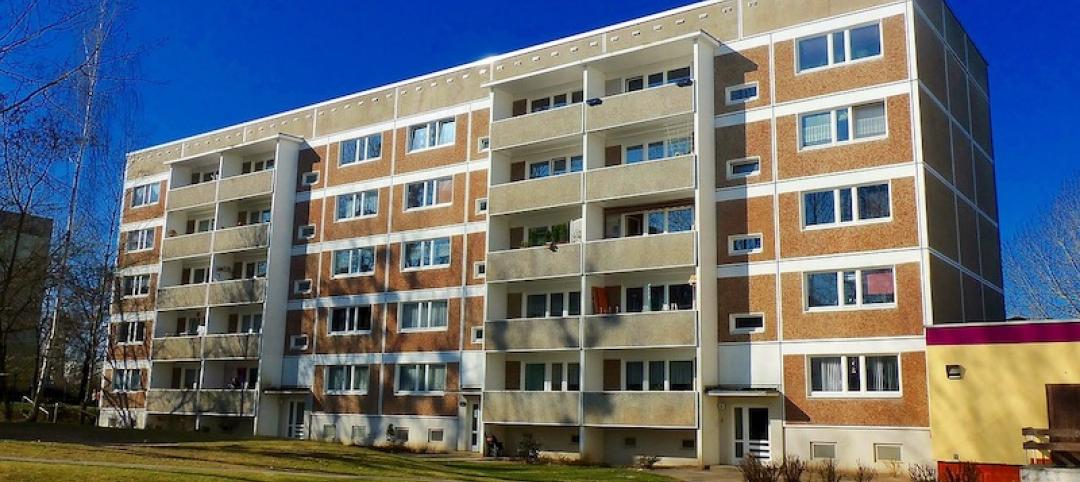
Apartment buildings and their residents contribute $3.4 trillion to the national economy
New data show how different aspects of the apartment industry positively impact national, state and local economies.

Market Data | Sep 3, 2019
Nonresidential construction spending slips in July 2019, but still surpasses $776 billion
Construction spending declined 0.3% in July, totaling $776 billion on a seasonally adjusted annualized basis.
Industry Research | Aug 29, 2019
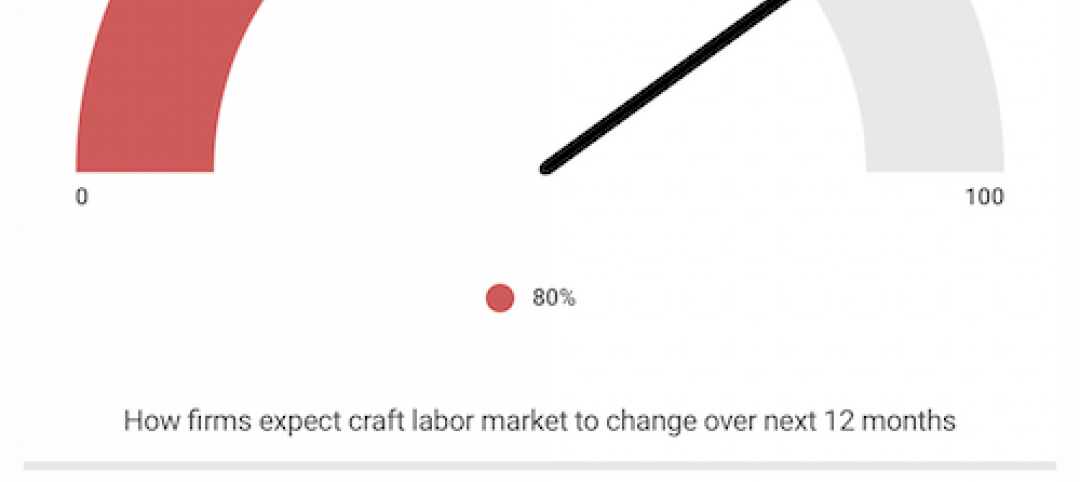
Construction firms expect labor shortages to worsen over the next year
A new AGC-Autodesk survey finds more companies turning to technology to support their jobsites.
Market Data | Aug 21, 2019
Architecture Billings Index continues its streak of soft readings
Decline in new design contracts suggests volatility in design activity to persist.
Market Data | Aug 19, 2019
Multifamily market sustains positive cycle
Year-over-year growth tops 3% for 13th month. Will the economy stifle momentum?
Market Data | Aug 16, 2019
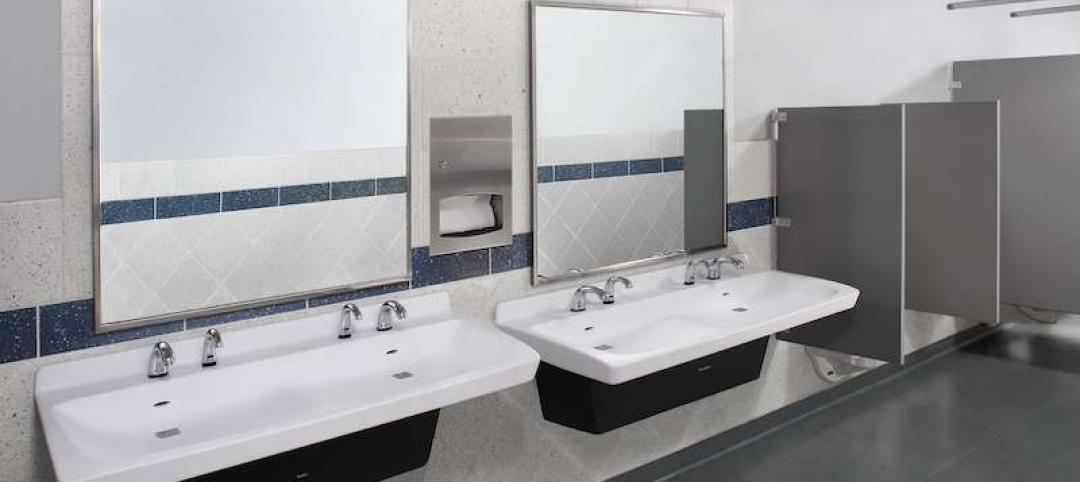
Students say unclean restrooms impact their perception of the school
The findings are part of Bradley Corporation’s Healthy Hand Washing Survey.

Market Data | Aug 12, 2019
Mid-year economic outlook for nonresidential construction: Expansion continues, but vulnerabilities pile up
Emerging weakness in business investment has been hinting at softening outlays.
Market Data | Aug 7, 2019
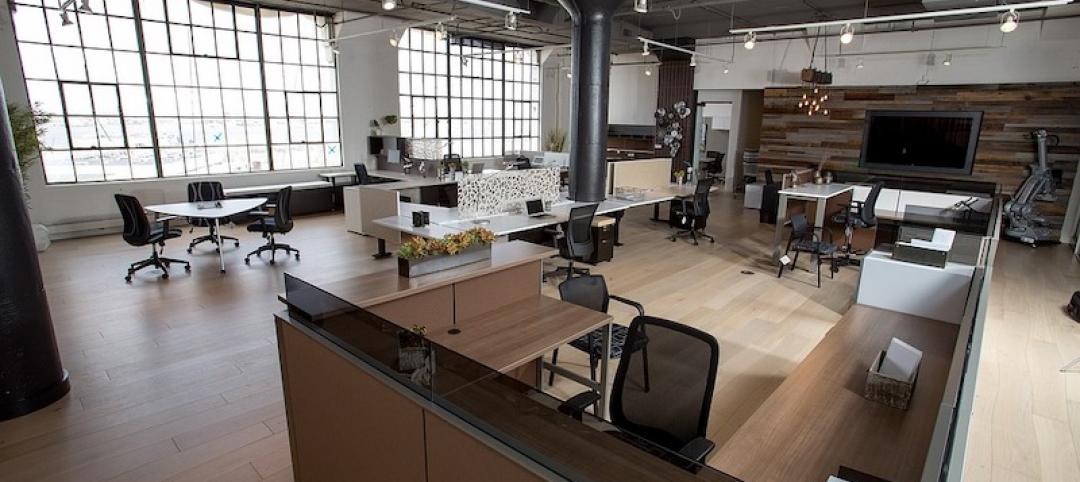
National office vacancy holds steady at 9.7% in slowing but disciplined market
Average asking rental rate posts 4.2% annual growth.
Market Data | Aug 1, 2019
Nonresidential construction spending slows in June, remains elevated
Among the 16 nonresidential construction spending categories tracked by the Census Bureau, seven experienced increases in monthly spending.

Market Data | Jul 31, 2019
For the second quarter of 2019, the U.S. hotel construction pipeline continued its year-over-year growth spurt
The growth spurt continued even as business investment declined for the first time since 2016.


