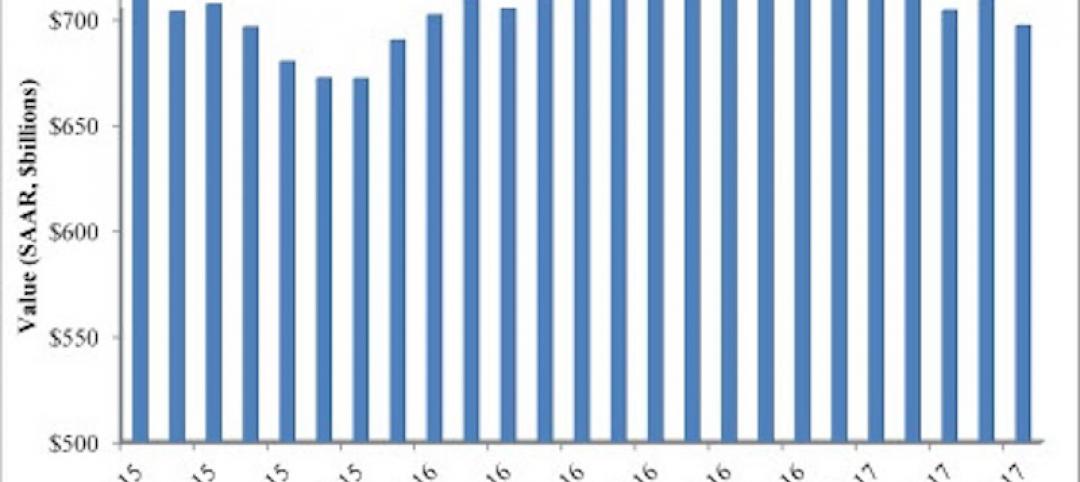
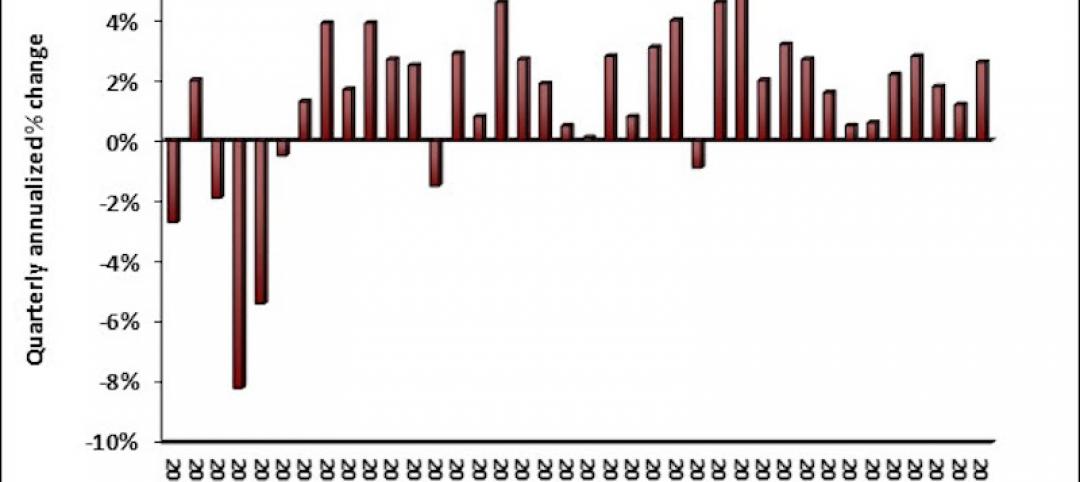
In its latest quarterly survey of U.S. construction costs, international property and construction cost-consultant firm Rider Levett Bucknall (RLB) reports that construction spending in the United States is on track to increase approximately 6% in 2016. Overall, the national average increase in construction costs for the quarter was approximately 1.5%.
Julian Anderson, President of RLB North America, said, “In our new report, we see continued positive news for the health of the construction industry, a slight uptick in the rate cost escalation, and a sharp decrease in the rate of construction unemployment. Looking ahead, barring a Democratic sweep of the Presidency and Congress, we do not see any big, near-term changes in either private- sector or public-sector construction activity.”
While current spending is falling short of the 20% growth seen by select segments of the industry in 2015, the outlook for the construction field as a whole is reasonably favorable. Continued low interest rates, rising consumer confidence, and healthy job growth also contribute to the guarded optimism.
Going forward, RLB sees a 5% expansion in construction spending for 2017. Based on a recent consensus forecast by the Urban Land Institute, the firm notes that past gains in activity may start to slow, suggesting the latter stages of a real estate cycle. National economic growth has been slower than previously anticipated, in part due to increasing national and international vulnerabilities. Combined with weakened domestic manufacturing output and investor uncertainty pending the results of the U.S. presidential election, these conditions may begin to create downward pressure on the construction industry in 2017.
About the Rider Levett Bucknall Quarterly Construction Cost Report
Rider Levett Bucknall reports on the comparative costs of construction in 12 U.S. cities on a quarterly basis, indexing them to show how costs are changing in each city, as well as against the costs of the other 11 locations. Together with additional international and national cost compendia, the cost research equips clients with complete and relevant information to assist in business decisions.
Related Stories
Market Data | Aug 17, 2017
Marcum Commercial Construction Index reports second quarter spending increase in commercial and office construction
Spending in all 12 of the remaining nonresidential construction subsectors retreated on both an annualized and monthly basis.
Industry Research | Aug 11, 2017
NCARB releases latest data on architectural education, licensure, and diversity
On average, becoming an architect takes 12.5 years—from the time a student enrolls in school to the moment they receive a license.
Market Data | Aug 4, 2017
U.S. grand total construction starts growth projection revised slightly downward
ConstructConnect’s quarterly report shows courthouses and sports stadiums to end 2017 with a flourish.
Market Data | Aug 2, 2017
Nonresidential Construction Spending falls in June, driven by public sector
June’s weak construction spending report can be largely attributed to the public sector.
Market Data | Jul 31, 2017
U.S. economic growth accelerates in second quarter; Nonresidential fixed investment maintains momentum
Nonresidential fixed investment, a category of GDP embodying nonresidential construction activity, expanded at a 5.2% seasonally adjusted annual rate.
Multifamily Housing | Jul 27, 2017
Apartment market index: Business conditions soften, but still solid
Despite some softness at the high end of the apartment market, demand for apartments will continue to be substantial for years to come, according to the National Multifamily Housing Council.
Market Data | Jul 25, 2017
What's your employer value proposition?
Hiring and retaining talent is one of the top challenges faced by most professional services firms.
Market Data | Jul 25, 2017
Moderating economic growth triggers construction forecast downgrade for 2017 and 2018
Prospects for the construction industry have weakened with developments over the first half of the year.
Industry Research | Jul 6, 2017
The four types of strategic real estate amenities
From swimming pools to pirate ships, amenities (even crazy ones) aren’t just perks, but assets to enhance performance.
Market Data | Jun 29, 2017
Silicon Valley, Long Island among the priciest places for office fitouts
Coming out on top as the most expensive market to build out an office is Silicon Valley, Calif., with an out-of-pocket cost of $199.22.


