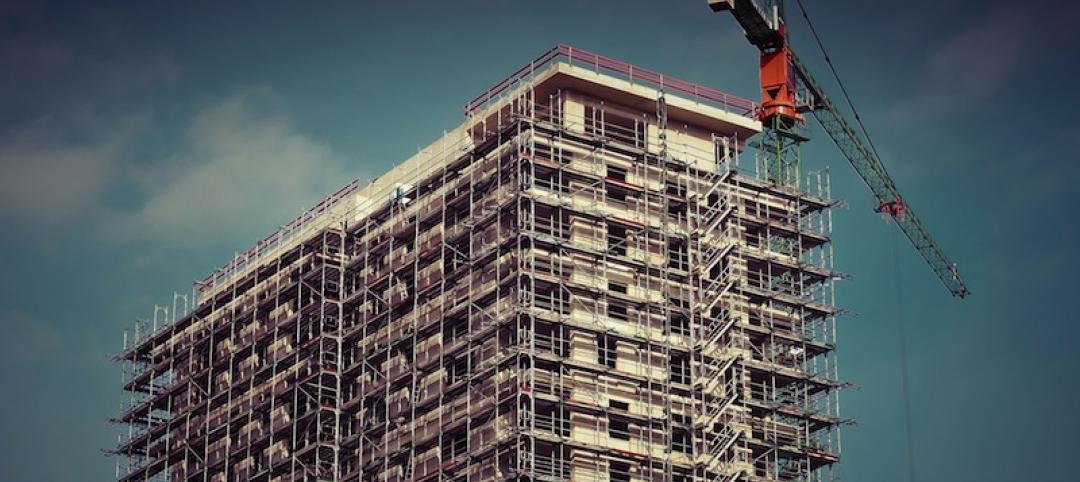
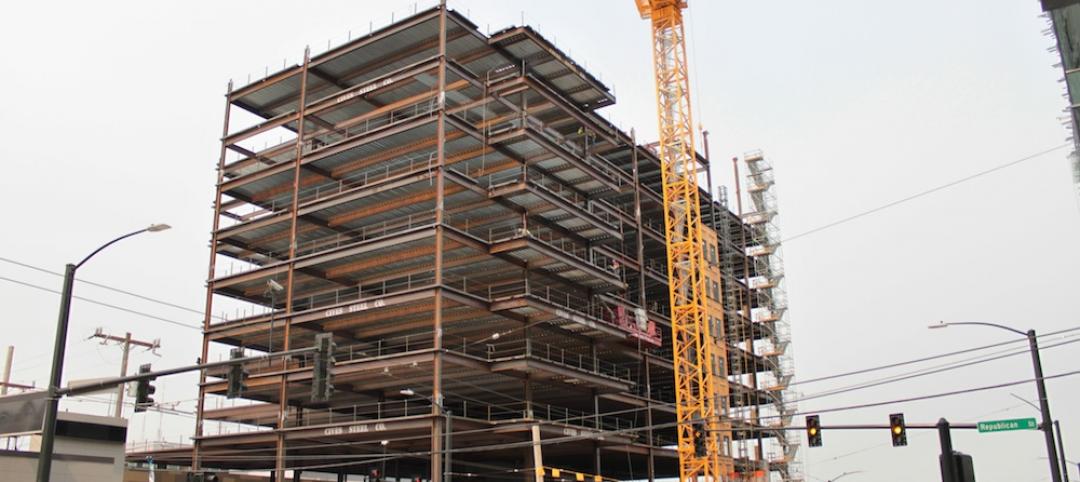
Construction employment increased in nearly two out of three U.S. metro areas between November 2020 and November 2021, according to an analysis by the Associated General Contractors of America of new government employment data. Association officials said the job gains were welcome news for the industry but cautioned that it will be difficult for construction levels to return to pre-pandemic levels amid tight labor market conditions.
“It isn’t surprising that construction employment has picked up in most metros over the past year, given the strong economic rebound most of the country has experienced,” said Ken Simonson, the association’s chief economist. “But with record job openings in construction, it’s clear that even more metros should be in the plus column if contractors could find the workers they need and get materials delivered on schedule.”
Construction employment increased in 237 or 66% of 358 metro areas over the last 12 months. Sacramento--Roseville--Arden-
Construction employment declined from a year earlier in 74 metros and was flat in 47. Nassau County-Suffolk County, N.Y. lost the most jobs (-6,300 or -8%), followed by Orange-Rockland-Westchester counties, N.Y. (-3,900 jobs, -9%); Calvert-Charles-Prince George’s counties, Md. (-2,700 jobs, -8%); Houston-The Woodlands-Sugar Land, Texas (-2,600 jobs, -1%) and Nashville-Davidson-
Association officials said most construction firms report they are struggling to find enough qualified workers to hire. The officials called on the Biden administration to boost funding for career and technical education to expose more students to construction career opportunities. They noted that federal officials put six dollars into collegiate education and preparation for every dollar they currently invest in career and technical education.
“The gap in federal funding for career and technical education is making it hard for sectors like construction, manufacturing and shipping to find workers interested in those career tracks,” said Stephen E. Sandherr, the association’s chief executive officer. “We are doing everything we can to recruit people into high-paying construction careers but exposing more students to construction skills will certainly help.”
View the metro employment data, rankings, top 10, and new highs and lows.
Related Stories
Market Data | Apr 4, 2016
ABC: Nonresidential spending slip in February no cause for alarm
Spending in the nonresidential sector totaled $690.3 billion on a seasonally adjusted, annualized basis in February. The figure is a step back but still significantly higher than one year ago.
Market Data | Mar 30, 2016
10 trends for commercial real estate: JLL report
The report looks at global threats and opportunities, and how CRE firms are managing their expectations for growth.
Market Data | Mar 23, 2016
AIA: Modest expansion for Architecture Billings Index
Business conditions softening most in Midwest in recent months.
Retail Centers | Mar 16, 2016
Food and technology will help tomorrow’s malls survive, says CallisonRTKL
CallisonRTKL foresees future retail centers as hubs with live/work/play components.
Market Data | Mar 6, 2016
Real estate execs measure success by how well they manage ‘talent,’ costs, and growth
A new CBRE survey finds more companies leaning toward “smarter” workspaces.
Market Data | Mar 1, 2016
ABC: Nonresidential spending regains momentum in January
Nonresidential construction spending expanded 2.5% on a monthly basis and 12.3% on a yearly basis, totaling $701.9 billion. Spending increased in January in 10 of 16 nonresidential construction sectors.
Market Data | Mar 1, 2016
Leopardo releases 2016 Construction Economics Report
This year’s report shows that spending in 2015 reached the highest level since the Great Recession. Total spending on U.S. construction grew 10.5% to $1.1 trillion, the largest year-over-year gain since 2007.
Market Data | Feb 26, 2016
JLL upbeat about construction through 2016
Its latest report cautions about ongoing cost increases related to finding skilled laborers.
Market Data | Feb 17, 2016
AIA reports slight contraction in Architecture Billings Index
Multifamily residential sector improving after sluggish 2015.
Market Data | Feb 11, 2016
AIA: Continued growth expected in nonresidential construction
The American Institute of Architects’ semi-annual Consensus Construction Forecast indicates a growth of 8% in construction spending in 2016, and 6.7% the following year.


