


National nonresidential construction spending declined 0.4% in August, according to an Associated Builders and Contractors analysis of U.S. Census Bureau data published today. On a seasonally adjusted annualized basis, spending totaled $773.8 billion, 0.3% higher than in August 2018.
Private nonresidential spending fell 1% on a monthly basis and is down 2.8% compared to the same time last year. Public nonresidential construction expanded 0.4% for the month and 4.8% for the year.
"Nonresidential construction spending is down nearly 3% from its peak in April 2019 due to declines in private construction,” said ABC Chief Economist Anirban Basu. "Construction spending in the commercial category, which encompasses retail space among other segments, is down nearly 12% on a year-over-year basis. Spending related to lodging, including new hotel construction, was down 0.7% for the month and is up less than 4% year over year. Spending in the power segment also decreased in August and is down 3.5% compared to the same time last year."
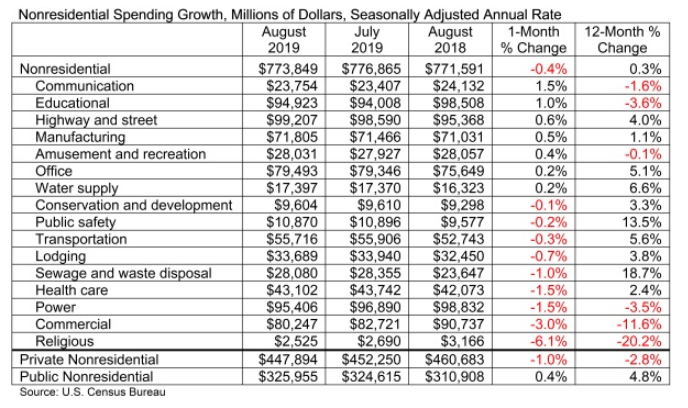
“All of this is consistent with a slowing economy, especially as measures such as industrial production and capacity utilization remain stagnant,” said Basu. “While this could be attributed to trade wars and a slowing global economy, construction dynamics are rarely so simple. Another likely explanation is that America’s growing shortage of skilled construction workers has driven up the cost of delivering construction services, even in the context of flat materials prices, resulting in more project owners delaying projects.
“On the other hand, public construction spending continues to rise,” said Basu. “Construction spending on public safety is up 13.5% on a year-over-year basis and spending in the sewage/waste disposal category is up nearly 19%. State and local governments continue to benefit from an economy that has pushed property tax, sales tax and income tax collections higher. Low borrowing costs also serve as an inducement to leverage revenues with debt, resulting in more infrastructure spending. Given the recent path of interest rates, this dynamic should continue into 2020.”
Related Stories

Market Data | Jan 29, 2018
Year-end data show economy expanded in 2017; Fixed investment surged in fourth quarter
The economy expanded at an annual rate of 2.6% during the fourth quarter of 2017.

Market Data | Jan 25, 2018
Renters are the majority in 42 U.S. cities
Over the past 10 years, the number of renters has increased by 23 million.

Market Data | Jan 24, 2018
HomeUnion names the most and least affordable rental housing markets
Chicago tops the list as the most affordable U.S. metro, while Oakland, Calif., is the most expensive rental market.

Market Data | Jan 12, 2018
Construction input prices inch down in December, Up YOY despite low inflation
Energy prices have been more volatile lately.

Market Data | Jan 4, 2018
Nonresidential construction spending ticks higher in November, down year-over-year
Despite the month-over-month expansion, nonresidential spending fell 1.3 percent from November 2016.

Contractors | Jan 4, 2018
Construction spending in a ‘mature’ period of incremental growth
Labor shortages are spiking wages. Materials costs are rising, too.
 reported the November ABI score was 55.0, up from a score of 51.7 in the previous month. Photo: Pixabay")
Market Data | Dec 20, 2017
Architecture billings upturn shows broad strength
The American Institute of Architects (AIA) reported the November ABI score was 55.0, up from a score of 51.7 in the previous month.

Market Data | Dec 14, 2017
ABC chief economist predicts stable 2018 construction economy
There are risks to the 2018 outlook as a number of potential cost increases could come into play.

Market Data | Dec 13, 2017
Top world regions and markets in the global hotel construction pipeline
The top world region by project count is North America.

Market Data | Dec 11, 2017
Global hotel construction pipeline is growing
The Total Pipeline stands at 12,427 Projects/2,084,940 Rooms.


