


National nonresidential construction spending declined 0.4% in August, according to an Associated Builders and Contractors analysis of U.S. Census Bureau data published today. On a seasonally adjusted annualized basis, spending totaled $773.8 billion, 0.3% higher than in August 2018.
Private nonresidential spending fell 1% on a monthly basis and is down 2.8% compared to the same time last year. Public nonresidential construction expanded 0.4% for the month and 4.8% for the year.
"Nonresidential construction spending is down nearly 3% from its peak in April 2019 due to declines in private construction,” said ABC Chief Economist Anirban Basu. "Construction spending in the commercial category, which encompasses retail space among other segments, is down nearly 12% on a year-over-year basis. Spending related to lodging, including new hotel construction, was down 0.7% for the month and is up less than 4% year over year. Spending in the power segment also decreased in August and is down 3.5% compared to the same time last year."
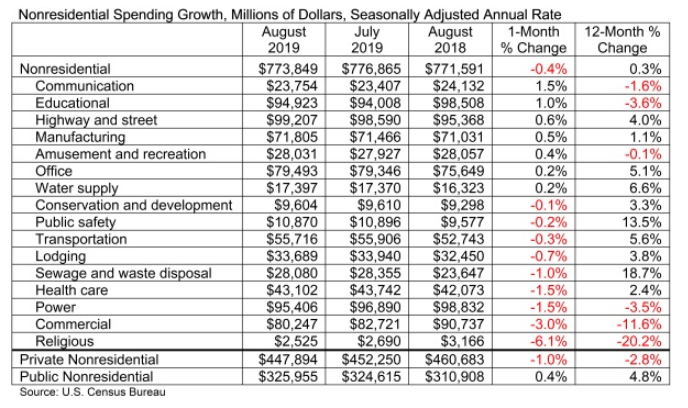
“All of this is consistent with a slowing economy, especially as measures such as industrial production and capacity utilization remain stagnant,” said Basu. “While this could be attributed to trade wars and a slowing global economy, construction dynamics are rarely so simple. Another likely explanation is that America’s growing shortage of skilled construction workers has driven up the cost of delivering construction services, even in the context of flat materials prices, resulting in more project owners delaying projects.
“On the other hand, public construction spending continues to rise,” said Basu. “Construction spending on public safety is up 13.5% on a year-over-year basis and spending in the sewage/waste disposal category is up nearly 19%. State and local governments continue to benefit from an economy that has pushed property tax, sales tax and income tax collections higher. Low borrowing costs also serve as an inducement to leverage revenues with debt, resulting in more infrastructure spending. Given the recent path of interest rates, this dynamic should continue into 2020.”
Related Stories

Hotel Facilities | Jul 28, 2022
As travel returns, U.S. hotel construction pipeline growth follows
According to the recently released United States Construction Pipeline Trend Report from Lodging Econometrics (LE), the total U.S. construction pipeline stands at 5,220 projects/621,268 rooms at the close of 2022’s second quarter, up 9% Year-Over-Year (YOY) by projects and 4% YOY by rooms.

Codes and Standards | Jul 22, 2022
Hurricane-resistant construction may be greatly undervalued
New research led by an MIT graduate student at the school’s Concrete Sustainability Hub suggests that the value of buildings constructed to resist wind damage in hurricanes may be significantly underestimated.

Market Data | Jul 21, 2022
Architecture Billings Index continues to stabilize but remains healthy
Architecture firms reported increasing demand for design services in June, according to a new report today from The American Institute of Architects (AIA).

Market Data | Jul 21, 2022
Despite deteriorating economic conditions, nonresidential construction spending projected to increase through 2023
Construction spending on buildings is projected to increase just over nine percent this year and another six percent in 2023, according to a new report from the American Institute of Architects (AIA).

Building Team | Jul 18, 2022
Understanding the growing design-build market
FMI’s new analysis of the design-build market forecast for the next fives years shows that this delivery method will continue to grow, despite challenges from the COVID-19 pandemic.

Market Data | Jul 1, 2022
Nonresidential construction spending slightly dips in May, says ABC
National nonresidential construction spending was down by 0.6% in May, according to an Associated Builders and Contractors analysis of data published today by the U.S. Census Bureau.

Market Data | Jun 30, 2022
Yardi Matrix releases new national rent growth forecast
Rents in most American cities continue to rise slightly each month, but are not duplicating the rapid escalation rates exhibited in 2021.

Market Data | Jun 22, 2022
Architecture Billings Index slows but remains strong
Architecture firms reported increasing demand for design services in May, according to a new report today from The American Institute of Architects (AIA).

Building Team | Jun 17, 2022
Data analytics in design and construction: from confusion to clarity and the data-driven future
Data helps virtual design and construction (VDC) teams predict project risks and navigate change, which is especially vital in today’s fluctuating construction environment.

Market Data | Jun 15, 2022
ABC’s construction backlog rises in May; contractor confidence falters
Associated Builders and Contractors reports today that its Construction Backlog Indicator increased to nine months in May from 8.8 months in April, according to an ABC member survey conducted May 17 to June 3. The reading is up one month from May 2021.


