

Following a sizable decrease in demand for design services in March, the April Architecture Billings Index (ABI) climbed back into positive territory according to a new report today from The American Institute of Architects (AIA).
AIA’s ABI score for April showed a small increase in design services at 50.5 in April, which is up from 47.8 in March. Any score above 50 indicates an increase in billings. Additionally, business conditions remained strong at firms located in the South. Despite this and the positive overall billings score, most regional and sector indictors continue to display decreasing demand for design services.
“In contrast to 2018, conditions throughout the construction sector recently have become more unsettled,” said AIA Chief Economist Kermit Baker, PhD, Hon. AIA. “Though we may not be at a critical inflection point, the next several months of billing data will be indicative of the health of the industry going into 2020.”
Key ABI highlights for April include:
— Regional averages: South (51.6); Midwest (49.3); West (49.0); Northeast (45.1)
— Sector index breakdown: mixed practice (53.2); institutional (49.2); multi-family residential (47.4); commercial/industrial (46.6)
— Project inquiries index: 60.9
— Design contracts index: 52.1
The regional and sector categories are calculated as a three-month moving average, whereas the national index, design contracts and inquiries are monthly numbers.
Related Stories

Market Data | Jun 18, 2018
AI is the path to maximum profitability for retail and FMCG firms
Leading retailers including Amazon, Alibaba, Lowe’s and Tesco are developing their own AI solutions for automation, analytics and robotics use cases.

Market Data | Jun 12, 2018
Yardi Matrix report details industrial sector's strength
E-commerce and biopharmaceutical companies seeking space stoke record performances across key indicators.
Market Data | Jun 8, 2018
Dodge Momentum Index inches up in May
May’s gain was the result of a 4.7% increase by the commercial component of the Momentum Index.
Market Data | Jun 4, 2018
Nonresidential construction remains unchanged in April
Private sector spending increased 0.8% on a monthly basis and is up 5.3% from a year ago.
Market Data | May 30, 2018
Construction employment increases in 256 metro areas between April 2017 & 2018
Dallas-Plano-Irving and Midland, Texas experience largest year-over-year gains; St. Louis, Mo.-Ill. and Bloomington, Ill. have biggest annual declines in construction employment amid continuing demand.

Market Data | May 29, 2018
America’s fastest-growing cities: San Antonio, Phoenix lead population growth
San Antonio added 24,208 people between July 2016 and July 2017, according to U.S. Census Bureau data.
Market Data | May 25, 2018
Construction group uses mobile technology to make highway work zones safer
Mobile advertising campaign urges drivers who routinely pass through certain work zones to slow down and be alert as new data shows motorists are more likely to be injured than construction workers.

Market Data | May 23, 2018
Architecture firm billings strengthen in April
Firms report solid growth for seven straight months.
Market Data | May 22, 2018
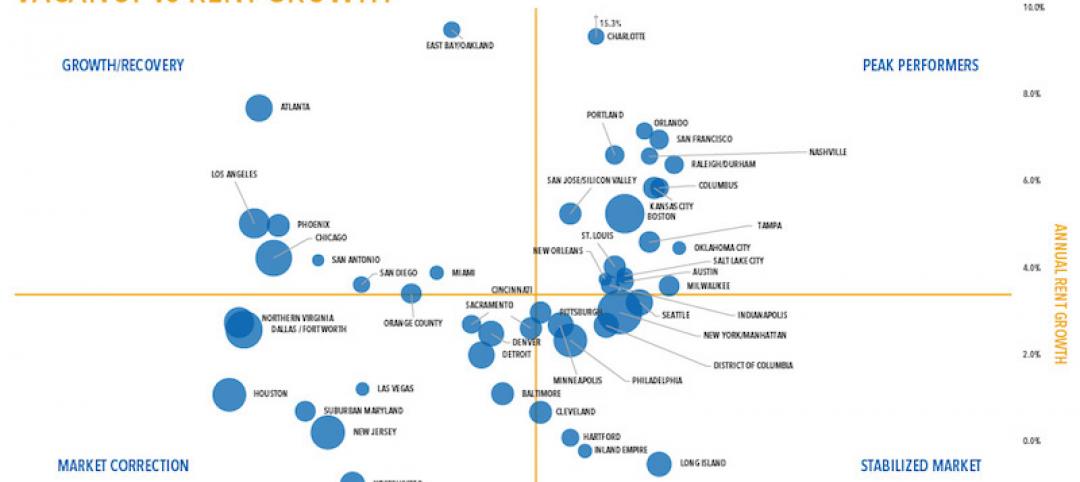
Vacancies stable, rents rising, and pipeline receding, according to Transwestern’s 1Q US Office Market report
The Big Apple still leads the new construction charge.

Market Data | May 18, 2018
Construction employment rises in 38 states and D.C. from April 2017 to April 2018
California & West Virginia have biggest annual job gains, North Dakota has largest decline; California & Louisiana have largest monthly pickup, Indiana & North Dakota lead monthly drops.


