


Analysts at Lodging Econometrics (LE) reported for the second quarter of 2019, the total U.S. construction pipeline climbed to 5,653 projects/693,207 rooms, up 6% by projects and 9% by rooms year-over-year (YOY). Pipeline totals are just 230 projects shy of the all-time high of 5,883 projects/785,547 rooms reached in the second quarter of 2008.
Projects currently under construction stand at 1,727 projects/233,600 rooms with projects scheduled to start construction in the next 12 months at 2,552 projects/295,989 rooms. Both are at the highest levels since early 2008. Projects in the early planning stage stand at 1,374 projects/163,618 rooms.
In the first half of 2019, the industry opened 456 new hotels with 53,427 rooms. An additional 599 projects/66,300 rooms are expected to open by year-end. In 2020, the LE forecasts for new hotel openings continues to rise with 1,161 new hotels/129,531 rooms scheduled to open. In 2021, with a growth rate of 2.5%, 1,206 new hotels with 139,793 rooms are likely to open as a result of the current robust pipeline. Should all these hotels come to fruition, 2021 will register the highest count for new hotel openings since 2009.
Trendline analysis suggests that the pipeline is in a topping out formation as new project announcements into the pipeline in the second quarter are at 359 projects/ 44,895 rooms, their lowest count since the fourth quarter of 2014. Brand to brand conversions have also declined over the last year and are at the lowest level since the end of 2016.
Although government spending and consumer sentiment and spending remain strong, these declines can be attributed to business spending declines which have turned negative for the first time since early 2016. Declines are due primarily to the uncertainty caused by trade and tariff problems and the slowing global economy.
Leading Markets in The U.S. Hotel Construction Pipeline
At the end of the first half of 2019, analysts at Lodging Econometrics (L.E.) report that the top five markets with the largest hotel construction pipelines are New York City with 166 projects/28,231 rooms. Next are Dallas and Los Angeles with 162 projects/19,972 rooms and 158 projects/25,428 rooms, respectively. Houston follows with 146 projects/14,998 rooms, and Atlanta with 130 projects/17,280 rooms. With the exception of NYC and Houston, these top markets are at record high counts.
The top ten markets in the pipeline including the five markets mentioned above plus Nashville, Austin, Orlando, Detroit, and Charlotte account for 25% of the rooms in the total pipeline. Ten states claim a whopping 61% of the rooms in the pipeline: Texas, California, Florida, New York, Georgia, Tennessee, North Carolina, Michigan, Colorado, and Ohio.
For the first half of 2019, the U.S. has opened 456 new hotels/53,527 rooms with another 599 new hotels/66,300 rooms expected to open by year-end. Reflective of the robust pipeline, L.E.’s forecast for new hotel openings will continue to rise through 2021.
Twenty-five percent of the new hotels forecast to open between now and the 2021 year-end are concentrated in ten markets. These markets are New York City, Los Angeles, Orlando, Dallas, Atlanta, Nashville, Houston, Washington DC, Miami, and Phoenix. The top 25 markets are forecast to open 40% of the rooms expected to open.
Related Stories
Market Data | Dec 11, 2017
Construction backlog surges, sets record in third quarter
CBI is a leading economic indicator that reflects the amount of construction work under contract, but not yet completed.
Market Data | Dec 7, 2017
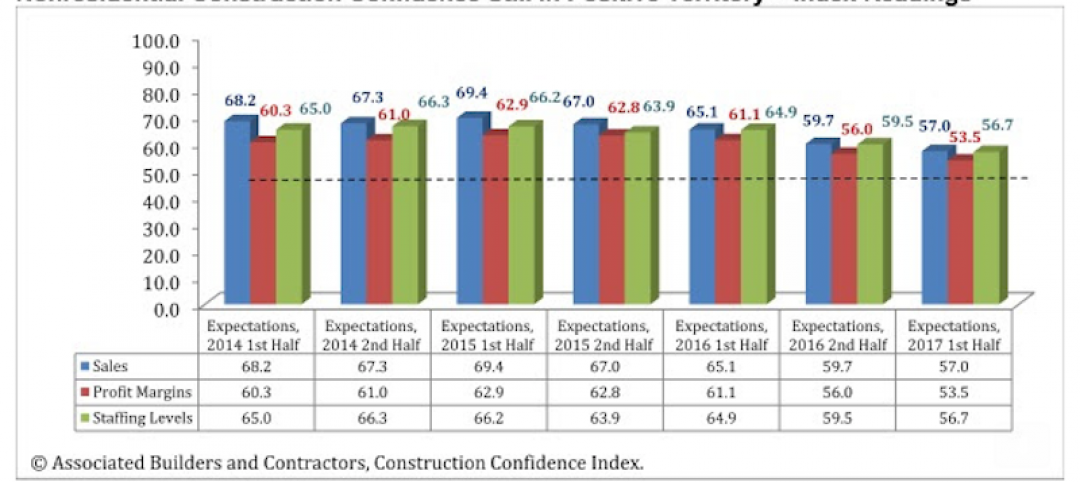
Buoyed by healthy economy, ABC Index finds contractors upbeat
Despite rising construction labor and materials costs, 55% of contractors expect their profit margins to expand in the first half of 2018.

Market Data | Dec 5, 2017
Top health systems engaged in $21 billion of U.S. construction projects
Largest active projects are by Sutter Health, New York Presbyterian, and Scripps Health.

Industry Research | Nov 28, 2017
2018 outlook: Economists point to slowdown, AEC professionals say ‘no way’
Multifamily housing and senior living developments head the list of the hottest sectors heading into 2018, according a survey of 356 AEC professionals.
Market Data | Nov 27, 2017
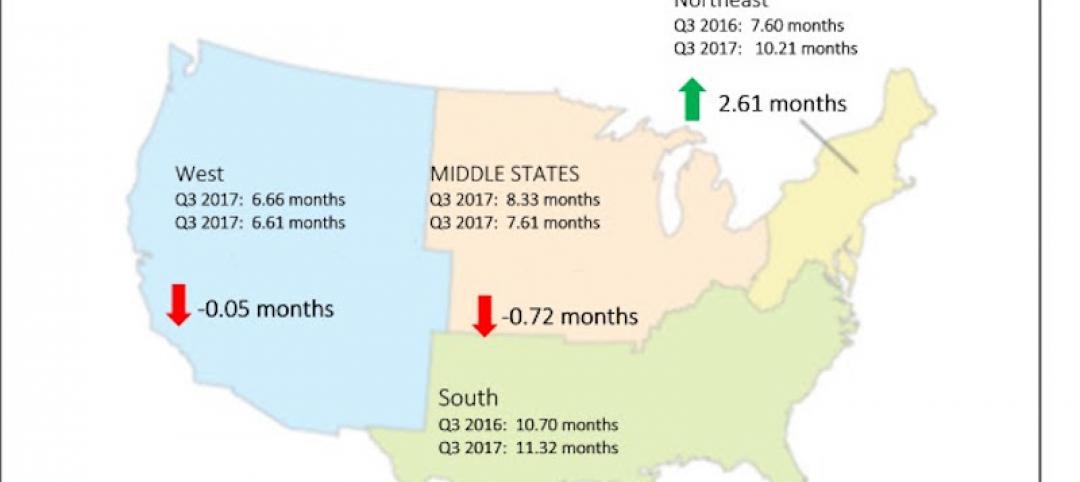
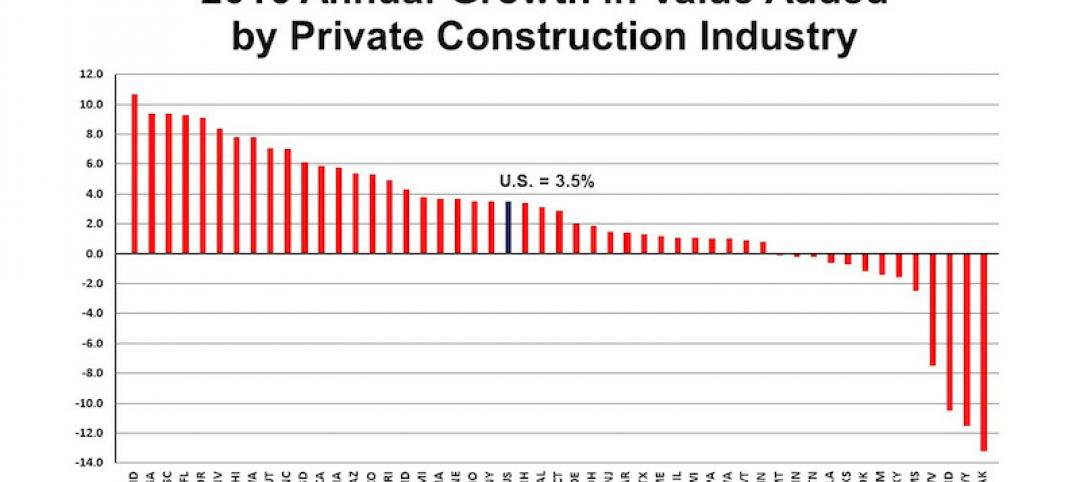
Construction's contribution to U.S. economy highest in seven years
Thirty-seven states benefited from the rise in construction activity in their state, while 13 states experienced a reduction in activity.
Market Data | Nov 15, 2017
Architecture Billings bounce back
Business conditions remain uneven across regions.
Market Data | Nov 14, 2017
U.S. construction starts had three consecutive quarters of positive growth in 2017
ConstructConnect’s quarterly report shows the most significant annual growth in the civil engineering and residential sectors.

Market Data | Nov 3, 2017
New construction starts in 2018 to increase 3% to $765 billion: Dodge report
Dodge Outlook Report predicts deceleration but still growth, reflecting a mixed pattern by project type.
Market Data | Nov 2, 2017
Construction spending up in September; Down on a YOY basis
Nonresidential construction spending is down 2.9% on a year-over-year basis.
Market Data | Oct 19, 2017
Architecture Billings Index backslides slightly
Business conditions easing in the West.


