


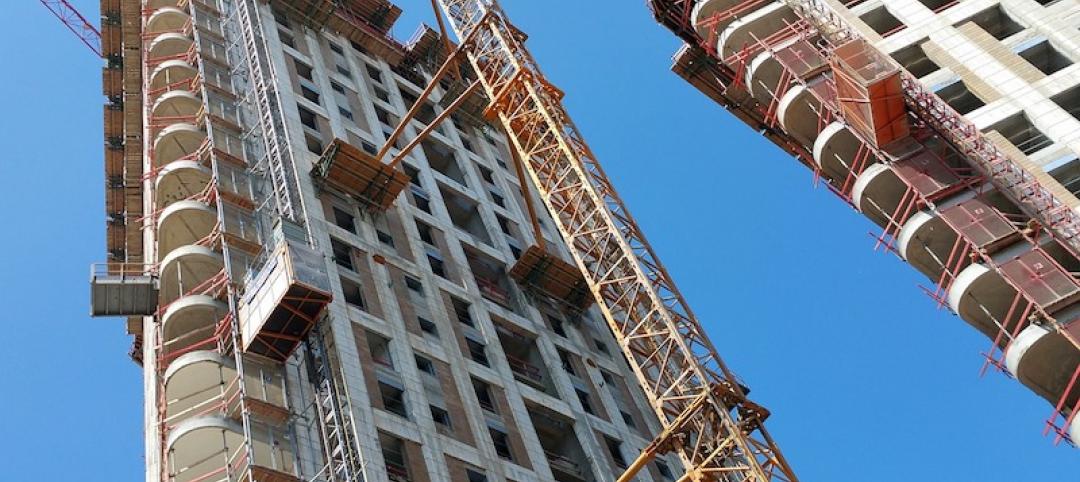
Analysts at Lodging Econometrics (LE) reported for the second quarter of 2019, the total U.S. construction pipeline climbed to 5,653 projects/693,207 rooms, up 6% by projects and 9% by rooms year-over-year (YOY). Pipeline totals are just 230 projects shy of the all-time high of 5,883 projects/785,547 rooms reached in the second quarter of 2008.
Projects currently under construction stand at 1,727 projects/233,600 rooms with projects scheduled to start construction in the next 12 months at 2,552 projects/295,989 rooms. Both are at the highest levels since early 2008. Projects in the early planning stage stand at 1,374 projects/163,618 rooms.
In the first half of 2019, the industry opened 456 new hotels with 53,427 rooms. An additional 599 projects/66,300 rooms are expected to open by year-end. In 2020, the LE forecasts for new hotel openings continues to rise with 1,161 new hotels/129,531 rooms scheduled to open. In 2021, with a growth rate of 2.5%, 1,206 new hotels with 139,793 rooms are likely to open as a result of the current robust pipeline. Should all these hotels come to fruition, 2021 will register the highest count for new hotel openings since 2009.
Trendline analysis suggests that the pipeline is in a topping out formation as new project announcements into the pipeline in the second quarter are at 359 projects/ 44,895 rooms, their lowest count since the fourth quarter of 2014. Brand to brand conversions have also declined over the last year and are at the lowest level since the end of 2016.
Although government spending and consumer sentiment and spending remain strong, these declines can be attributed to business spending declines which have turned negative for the first time since early 2016. Declines are due primarily to the uncertainty caused by trade and tariff problems and the slowing global economy.
Leading Markets in The U.S. Hotel Construction Pipeline
At the end of the first half of 2019, analysts at Lodging Econometrics (L.E.) report that the top five markets with the largest hotel construction pipelines are New York City with 166 projects/28,231 rooms. Next are Dallas and Los Angeles with 162 projects/19,972 rooms and 158 projects/25,428 rooms, respectively. Houston follows with 146 projects/14,998 rooms, and Atlanta with 130 projects/17,280 rooms. With the exception of NYC and Houston, these top markets are at record high counts.
The top ten markets in the pipeline including the five markets mentioned above plus Nashville, Austin, Orlando, Detroit, and Charlotte account for 25% of the rooms in the total pipeline. Ten states claim a whopping 61% of the rooms in the pipeline: Texas, California, Florida, New York, Georgia, Tennessee, North Carolina, Michigan, Colorado, and Ohio.
For the first half of 2019, the U.S. has opened 456 new hotels/53,527 rooms with another 599 new hotels/66,300 rooms expected to open by year-end. Reflective of the robust pipeline, L.E.’s forecast for new hotel openings will continue to rise through 2021.
Twenty-five percent of the new hotels forecast to open between now and the 2021 year-end are concentrated in ten markets. These markets are New York City, Los Angeles, Orlando, Dallas, Atlanta, Nashville, Houston, Washington DC, Miami, and Phoenix. The top 25 markets are forecast to open 40% of the rooms expected to open.
Related Stories
Market Data | Aug 7, 2018
New supply's impact illustrated in Yardi Matrix national self storage report for July
The metro with the most units under construction and planned as a percent of existing inventory in mid-July was Nashville, Tenn.

Market Data | Aug 3, 2018
U.S. multifamily rents reach new heights in July
Favorable economic conditions produce a sunny summer for the apartment sector.
Market Data | Aug 2, 2018
Nonresidential construction spending dips in June
“The hope is that June’s construction spending setback is merely a statistical aberration,” said ABC Chief Economist Anirban Basu.

Market Data | Aug 1, 2018
U.S. hotel construction pipeline continues moderate growth year-over-year
The hotel construction pipeline has been growing moderately and incrementally each quarter.
Market Data | Jul 30, 2018
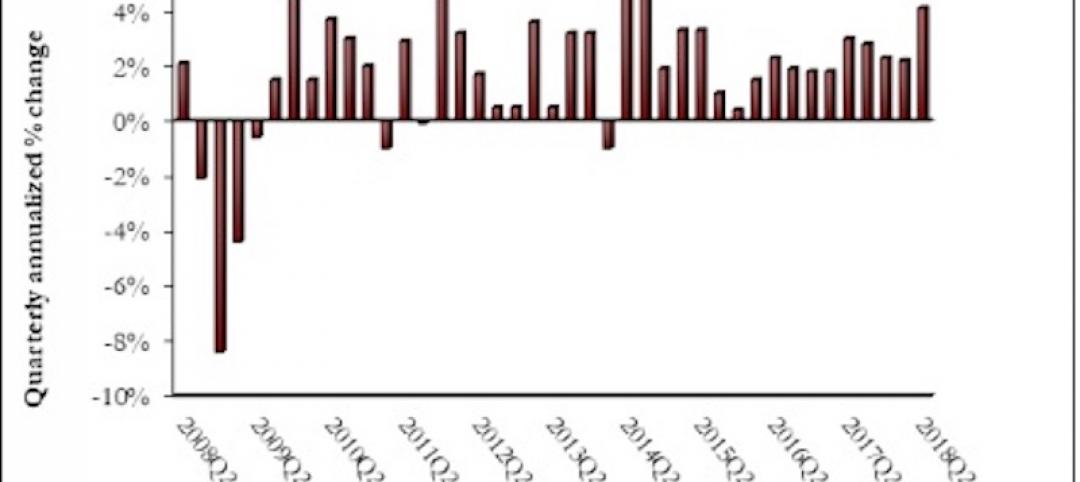
Nonresidential fixed investment surges in second quarter
Nonresidential fixed investment represented an especially important element of second quarter strength in the advance estimate.

Market Data | Jul 11, 2018
Construction material prices increase steadily in June
June represents the latest month associated with rapidly rising construction input prices.

Market Data | Jun 26, 2018
Yardi Matrix examines potential regional multifamily supply overload
Outsize development activity in some major metros could increase vacancy rates and stagnate rent growth.

Market Data | Jun 22, 2018
Multifamily market remains healthy – Can it be sustained?
New report says strong economic fundamentals outweigh headwinds.

Market Data | Jun 21, 2018
Architecture firm billings strengthen in May
Architecture Billings Index enters eighth straight month of solid growth.

Market Data | Jun 20, 2018
7% year-over-year growth in the global construction pipeline
There are 5,952 projects/1,115,288 rooms under construction, up 8% by projects YOY.


