


There are many new and exciting applications for data analysis in the construction industry, the vast majority of which employ new data aggregation tools to quantify and analyze specific aspects of the built environment, often numerical aspects like square foot totals, or asset management counts. But there are other important uses for data tools for more abstract attributes of the built environment, such as tracking, analyzing and evaluating risk.
This case-study details a facilities assessment for a government client who needed to understand the range of risk types and impacts that could potentially occur in their buildings. The analysis was triggered when a single pipe failure on the 11th floor of one facility unleashed a cascade of unforeseen consequences as it made its way to ground, almost paralyzing the facility for several days. The consequences rippled through the facility long after the event.
As a result, the client, a proactive owner-occupier, commissioned a comprehensive assessment of their three largest facilities to help enumerate and understand other similar vulnerabilities in each facility, so as to avoid future similar exposures.
Evaluating the Facilities
As a first step, the team visited the three facilities, totaling over two million SF, and surveyed each system’s equipment and arrangement. Because each of the facilities was large, and built over several decades, the range of equipment and systems encountered varied from new to those which were teetering on the end of their useful life. All of this data was captured with a brief narrative for each item, as well as a mitigation strategy.
Once the list of infrastructure, equipment, layout and configurations of each facility was completed, the team assigned each of the identified issues a category, such as site work, building envelope, electrical equipment, mechanical systems and even security protocols. In addition, they further classified each item according to two important decision-oriented factors: 1) its likelihood to occur, and 2) the impact of a failure were it to occur. They then took the categorized items and assigned a rough dollar amount to address and fix each work item.
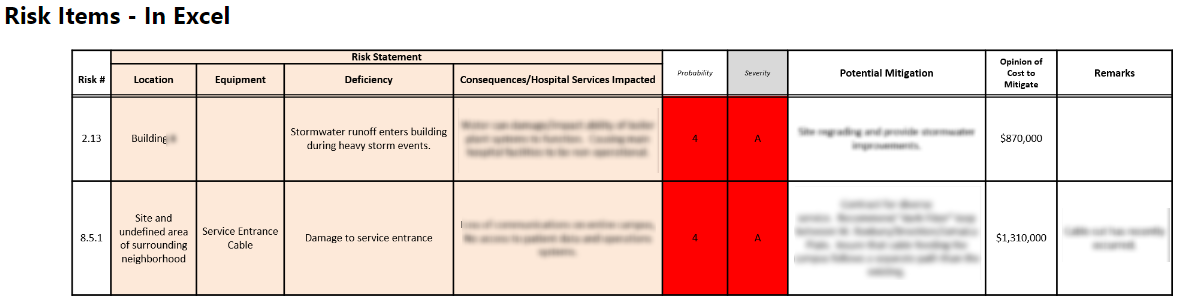
The data had several data categories, or “dimensions.”
When completed, the final spreadsheet was a lengthy inventory of future work-items arranged by category, cost, likelihood and severity. In data jargon, each of these traits – category, cost severity, likelihood, etc. - would be called ‘dimensions’, that is aspects of the item that help to understand the problem. Each dimension represents a way to slice the data. Thus, with the right tool an owner could start to drill into the hundreds of items, even with combinations of dimensions.
Leveraging Data Tools
With over 1,000 items cataloged and several dimensions to simultaneously evaluate, the next task was to address was how best to turn the data into information – that is actionable decisions to help address the facility needs. In its raw form, the initial spreadsheet report was rich with information but was somewhat cumbersome to navigate for everyday use by the facility manager.
ALSO SEE: BI(m): BIM data without models
In addition, with so many measures, the team needed the capability to drill down into the findings to be able to pose various questions:
• Which items were the most critical points of failure for service continuity?
• Were there certain categories of vulnerabilities that occurred frequently in each facility?
• What was the total capital cost by category, such as critical items and less critical items?
These were all valid questions that would take quite a while to deduce from a straight spreadsheet format. For the next step, the team imported the raw data into a data analysis application.
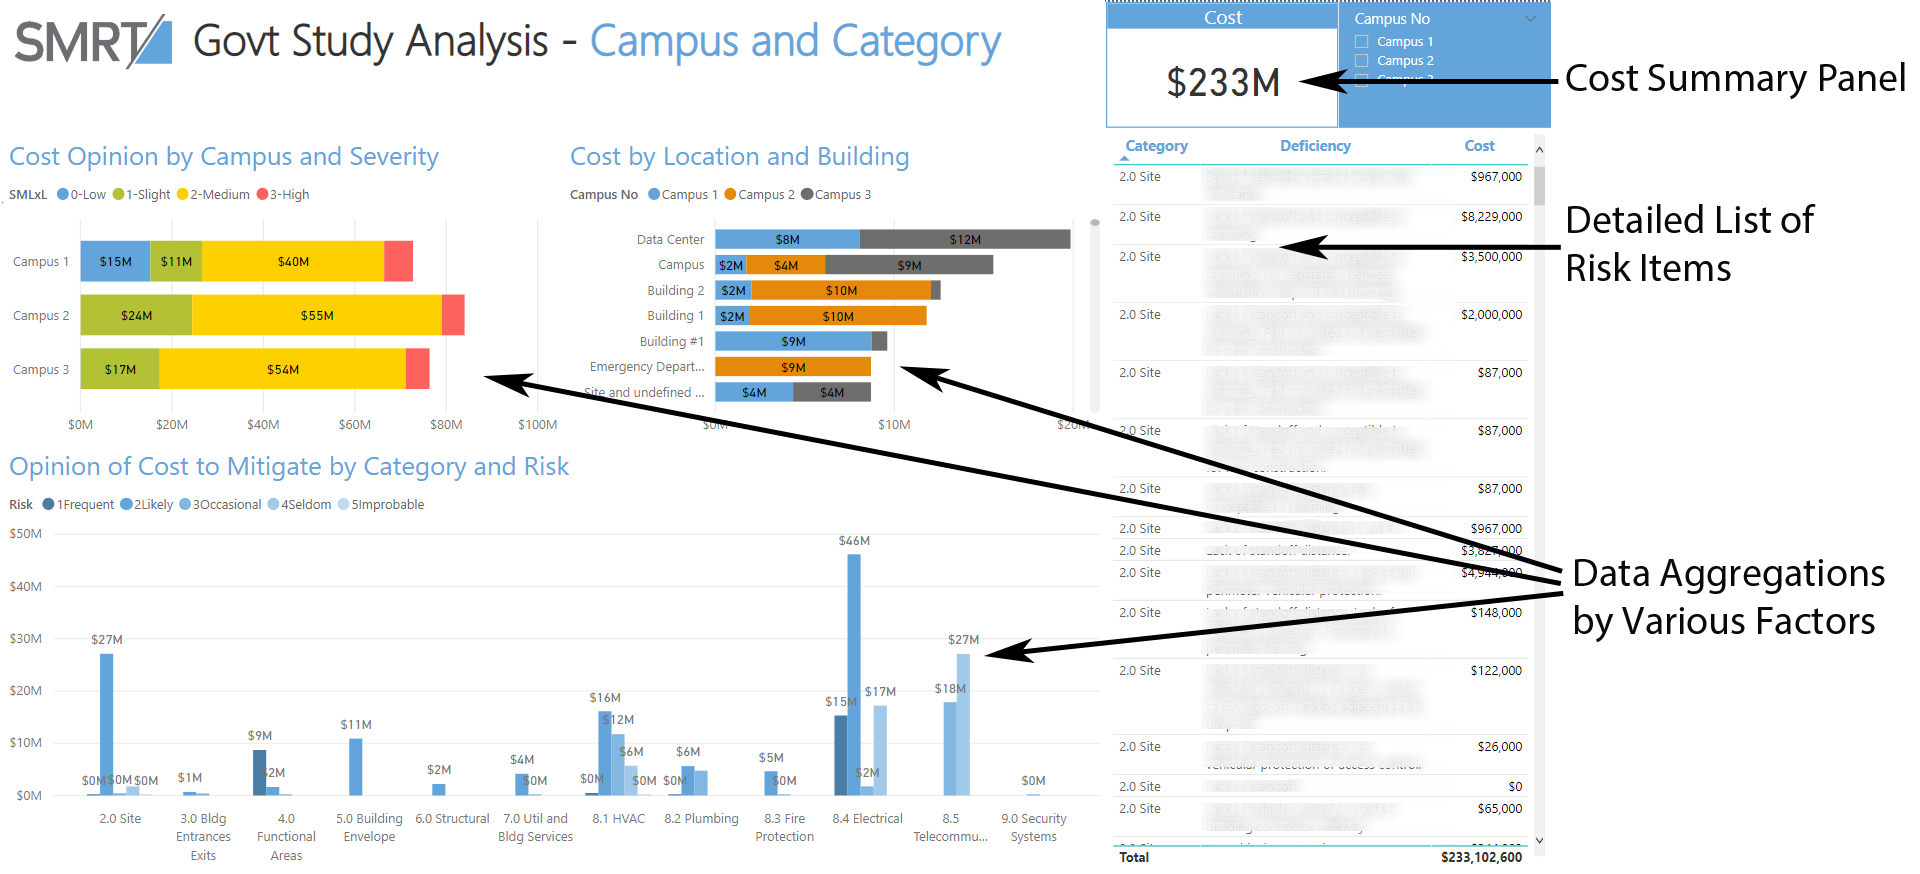
A collection of charts on a single page; each chart is interactive, so that clicking on it filters the surrounding charts.
By using the advanced pivoting and aggregation of data analytical tools, the engineering team was able to scrutinize the data and display it graphically in a way the facility manager could more readily comprehend. A diverse collection of tables and column charts, organized and colored by severity or category, told a far more vivid story of the work items for each facility. For example, it was easier to see which items needed to be addressed immediately and which were those that could happen sometime over a longer timeframe.
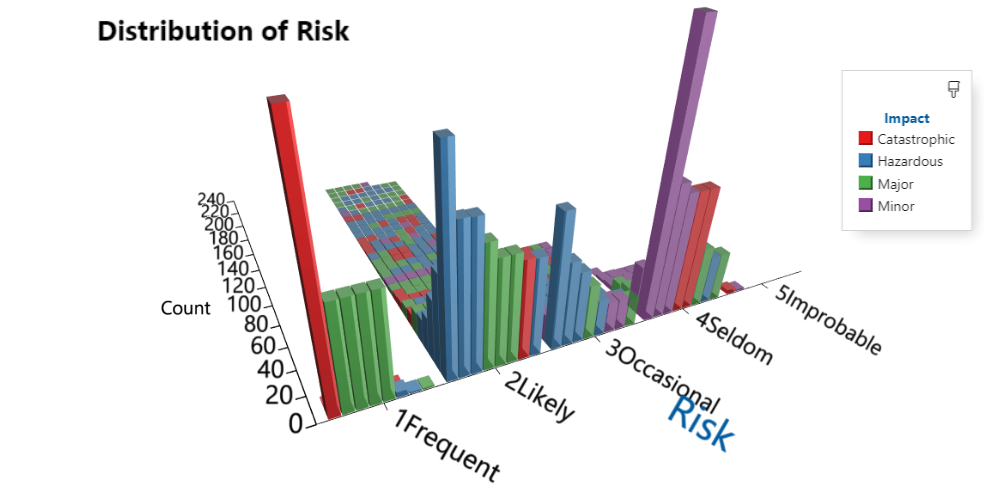
3D charts with a color legend can display four dimensions at once.
Using the data tools, the team was even able to create three-dimensional chart formats that provided a very rich assessment of each item by campus, capital cost, severity and likelihood of occurrence all in a single comprehensive view. Each item could also display additional information about the line item when the user hovered over it. Thus, the new data tools allowed the reader to comprehend major trends and highpoints in a highly integrated way.
Even after the site survey activity was complete, there were further opportunities to ‘extend’ - or enhance - the original raw survey data spreadsheet with other data points subsequent to the survey, such as an anticipated contract date for when each item might need to be performed. As a result, extending the data resulted in a date chart to gauge future expenditures for each year, and also an average yearly spend rate for the facilities. The team could see that in 15 years for example, a large sum of funds would be needed to avoid disruptions to services. This chart could be further analyzed by severity or impact.
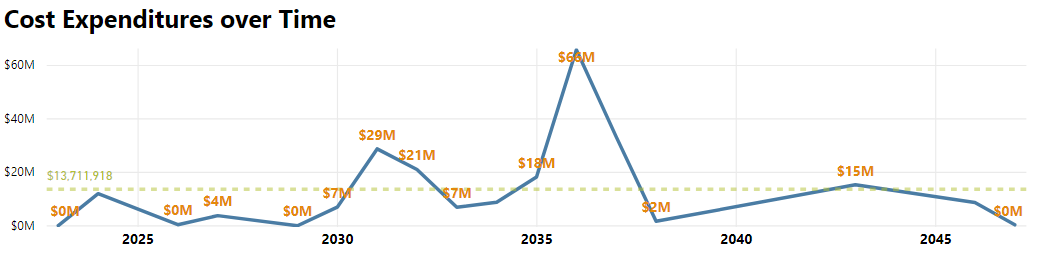
An anticipated contract date was added to each work item to forecast capital expenditures over the next 25 years.
Seeing the Forest AND the Tree
The risk analysis study illustrated how risk mitigation studies can be greatly enhanced with new data tools. We like to say that the team sees the power of data analytics to be that the owner “can see the forest AND the tree” – meaning, - where previous typical reports either summarized the findings, (the Forest), or itemized them in individual detail, (the Trees), - these new tools allowed the forest of measures to be displayed at once, and then through drilldown and interactive graphics, enabled custom aggregations as well as isolation of individual trees. As such, data analysis tools constitute a significant leap for facility managers and building professionals to help catalog, understand and strategize around facility conditions and plan future capital expenditures to address risks and vulnerabilities.
The uses of data in construction go far beyond mere floor areas and quantities, - in this case evaluating the risk posed to critical facilities. What is most valuable about these tools is how they helped to make complex and abstract aspects of buildings more visible.
About the Author
John Tobin is the Albany, N.Y., Office Director for SMRT Architects and Engineers, headquartered in Portland, Maine. He has spent three decades spearheading new practice technologies, especially BIM and advanced delivery, and then as an AE technology and operations leader. Most recently, Tobin has begun integrating new data analysis techniques with BIM processes.
Related Stories

AEC Tech | Feb 16, 2017
Positioning computational designers in your business: 4 things to consider
There appears to be very little industry consensus as to what a ‘computational design’ position actually means in a business setting.

AEC Tech | Jan 30, 2017
Building Design+Construction launches Accelerate Live! AEC innovation conference
This fast-paced forum will showcase 18 business and tech visionaries from AEC Giant firms, who will explore the future of the AEC industry and the changing built environment.
| Jan 24, 2017
BD+C Accelerate Live! AEC Innovation Conference
Building Design+Construction's inaugural Accelerate Live!
AEC Tech | Dec 22, 2016
The success of your data strategy depends on healthy business practices
Data and digital tools are an absolute given to today’s building design and construction process. But creating a true data-driven workflow requires more than just a solid strategy, writes Proving Ground’s Nathan Miller.

AEC Tech | Dec 18, 2016
Customized future weather data now available for online purchase
Simulation tool, developed by Arup and Argos Analytics, is offered to help owners and AEC firms devise resilience strategies for buildings.

Virtual Reality | Nov 16, 2016
Converting 3D model files to VR, with one click
IrisVR offers two new products to simplify and enhance the application of virtual reality for designing projects.

AEC Tech | Sep 6, 2016
Innovation intervention: How AEC firms are driving growth through R&D programs
AEC firms are taking a page from the tech industry, by infusing a deep commitment to innovation and disruption into their cultural DNA.

Hardware | Aug 11, 2016
Kyocera introduces the DuraForce PRO, a rugged smartphone equipped with an HD action camera (UPDATED)
The Super Wide View HD Action Camera and rugged design allow users to capture their adventures on land, air, or sea.

AEC Tech | Jun 27, 2016
If ‘only the paranoid survive,’ what does it take to thrive?
“Sooner or later, something fundamental in your business world will change.” The late Andrew Grove (1936-2016), Co-founder of tech giant Intel Corp., lived by these words.

AEC Tech | Jun 17, 2016
Driverless cars could soon start impacting commercial, retail project design
Offsite parking and more space for valet parking lines are among the foreseeable changes.


