

Residential construction enjoyed its seventh consecutive year of growth in 2016. But it still fell far short of annual averages during the 1980s and 1990s. And multifamily construction, which has been the industry’s engine for nearly a decade, flattened.
In its “State of the Nation’s Housing 2017,” which it released today, Harvard University’s Joint Center for Housing Studies notes that home prices rose 5.6% last year, “finally surpassing the high reached nearly a decade earlier.” But in inflation-adjusted terms, home values still remained nearly 15% below their previous high.
More significantly, housing availability, especially at the affordable end of the spectrum, remains in woefully short supply. Completions in the past 10 years totaled just 9 million units, or more than 4 million units less than the next-worst decade going back to the 1970s.
There were only 1.65 million existing homes available for sale last year, the lowest count in 16 years. “With sales volumes picking up, the inventory represented just 3.6 months of supply, an 11-year low,” the Joint Center states.
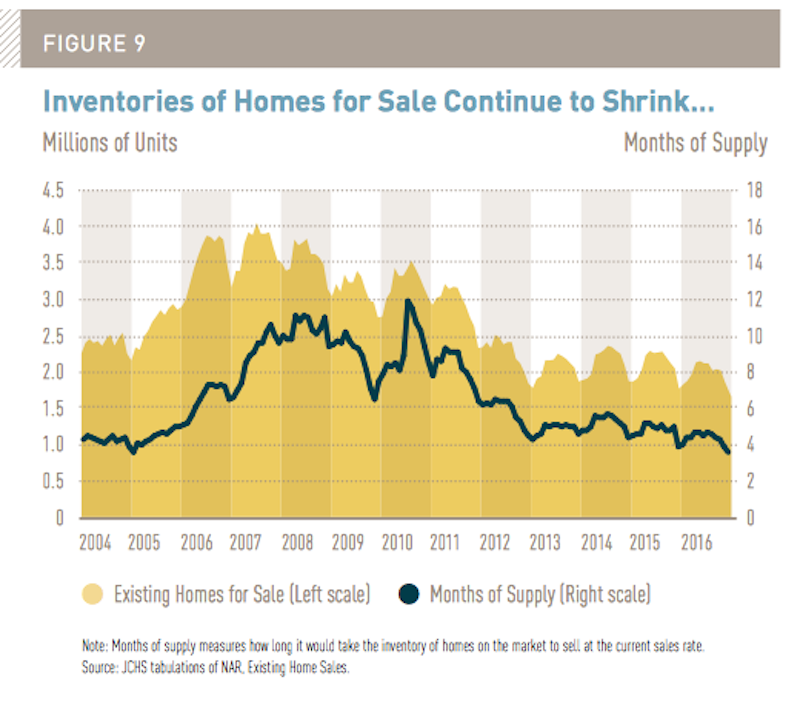 The inventory of existing homes for sale stood at 1.65 million at the end of 2016, a 16-year low. Inventory represented only a 3.6 month supply, an 11-year low. Image: Joint Center for Housing Studies.
Its report cites myriad factors behind these numbers. Labor shortages continue to constrain construction, as do regulatory and financing restrictions. And too many younger adults still don’t have the financial wherewithal to live independently. While the Millennial generation formed 7.6 million new households last year, 35.6% of adults aged 18 to 34 are still living with parents or grandparents, an all-time high.
The homeownership rate, which had been declining for 12 years, stabilized last year (it stood at 63.6% in the first quarter of 2017). But choosing renting over buying is no longer a transitory proposition for many Americans. Growth in renters continued to outpace owners, with their numbers increasing by 600,000 last year.
Some 43.3 million households now rent, and the rental share of U.S. households stands at a 50-year high of 37%, up more than five percentage points from 2004, when ownership peaked. Families with children are increasingly likely to rent rather than own their homes. The share of these households living in rental housing jumped to 39 percent in 2016 from 32 percent in 2005, accounting for 22 percent of renter household growth over this period.
The share of high-income households (earning more than $100,000) that rented also increased to 18% last year, from 12% in 2005.
Spending on multifamily housing was at a 10-year high, at $60.4 billion last year. However, multifamily construction—which many AEC firms engage—might be losing some steam.
Excluding the Northeast, multifamily starts rose 7.1% last year. But nationally, there were 393,000 multifamily starts in 2016, down slightly from 397,000 in 2015, and significantly below the annual averages in the 1970s (625,000), and the 1980s (507,000).
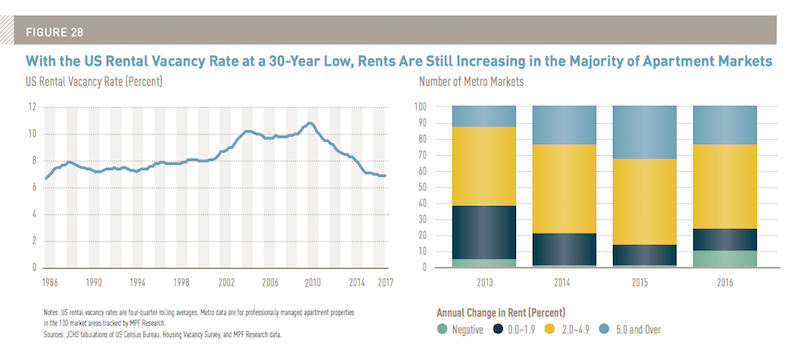
As rental inventory hasn't kept pace with demand, rents continue to rise across the country. Image: Joint Center for Housing Studies.
Over 90% of multifamily starts and completions last year were intended for the rental market, and more than 80% were in properties with 20 or more units. But this construction activity isn’t keeping up with demand, as rental vacancy rates slipped for the seventh straight year to a 30-year low of 6.9% in 2016. Rental markets in most areas of the country remain tight, the Joint Center states.
(A newly released study, by Hoyt Advisory Services, the National Multifamily Housing Council, and the National Apartment Association, estimates that the U.S. will need at least 325,000 new apartment units to meet demand through 2030.)
One bit of good news: The Joint Center estimates that completions of multifamily units totaled 321,000 in 2016, only slightly higher than the 2015 level but up 5 percent from annual averages in the 2000s. Construction of townhouses, often a desirable option for first-time buyers, has risen recently but still does not approach its pre-recession high. Townhouse completions stood at 98,000 units in 2016, more than double the number in 2009 but less than half that in 2005.
The bridge that, historically, has been a pathway for renters to homeownership looks shakier, primarily because of renters’ financial situations and escalating rents. The typical renter household had an annual income of $37,900, or about half of the $70,800 annual income of a typical homeowner household. Sixteen million renter households had annual incomes of less than $25,000, including 11 million with incomes below the federal poverty threshold.
Given its findings, the Joint Center projects that 13.6 million new U.S. households will be created between 2015 and 2025. Minorities will drive three quarters of that gain, with Hispanics alone accounting for one third. During this period, renter households could increase by 4.7 million if ownership rates stabilize, or by 8.7 million if renting continues to gain favor with more American families.
But in the following decade, total household creation is expected to slow to 11.5 million, with minorities accounting for a jaw-dropping 90% of that growth from 2025-2035. Millennials are projected to form an additional 34 million new households by 2035, “lifting the total number to just under 50 million—considerably more than the 43.2 million currently headed by members of Generation X,” the report states.
And don’t forget about those aging baby boomers. The number of households headed by adults age 65 of older will increase by 44% through 2025, and by 90% from 2025-2035. One in three households could be headed by older adults by 2035.
But where are people going to live? As it has perennially, the Joint Center decries the lack of affordable housing in the U.S. It expects demand for rental and entry-level owner-occupied homes to soar, but questions whether there will be adequate supply, “particularly for the most vulnerable—the very young and very old, those with disabilities, and those living in poverty.”
The report finds that, on average, 45 percent of renters in the nation’s metro areas could afford the monthly payments on a median-priced home in their market area. But in several high-cost metros of the Pacific Coast, Florida, and the Northeast, that share is under 25 percent.
With rents rising in general, there is a growing demand for housing assistance at a time when the government is cutting back. “For the 75 percent of households that are eligible for assistance but do not receive it, affordable housing choices are in increasingly limited supply,” the Joint Center states.
Related Stories

Contractors | Feb 14, 2023
The average U.S. contractor has nine months worth of construction work in the pipeline
Associated Builders and Contractors reports today that its Construction Backlog Indicator declined 0.2 months to 9.0 in January, according to an ABC member survey conducted Jan. 20 to Feb. 3. The reading is 1.0 month higher than in January 2022.

Office Buildings | Feb 9, 2023
Post-Covid Manhattan office market rebound gaining momentum
Office workers in Manhattan continue to return to their workplaces in sufficient numbers for many of their employers to maintain or expand their footprint in the city, according to a survey of more than 140 major Manhattan office employers conducted in January by The Partnership for New York City.

Giants 400 | Feb 9, 2023
New Giants 400 download: Get the complete at-a-glance 2022 Giants 400 rankings in Excel
See how your architecture, engineering, or construction firm stacks up against the nation's AEC Giants. For more than 45 years, the editors of Building Design+Construction have surveyed the largest AEC firms in the U.S./Canada to create the annual Giants 400 report. This year, a record 519 firms participated in the Giants 400 report. The final report includes 137 rankings across 25 building sectors and specialty categories.

Multifamily Housing | Feb 7, 2023
Multifamily housing rents flat in January, developers remain optimistic
Multifamily rents were flat in January 2023 as a strong jobs report indicated that fears of a significant economic recession may be overblown. U.S. asking rents averaged $1,701, unchanged from the prior month, according to the latest Yardi Matrix National Multifamily Report.

Market Data | Feb 6, 2023
Nonresidential construction spending dips 0.5% in December 2022
National nonresidential construction spending decreased by 0.5% in December, according to an Associated Builders and Contractors analysis of data published today by the U.S. Census Bureau. On a seasonally adjusted annualized basis, nonresidential spending totaled $943.5 billion for the month.

Architects | Jan 23, 2023
PSMJ report: The fed’s wrecking ball is hitting the private construction sector
Inflation may be starting to show some signs of cooling, but the Fed isn’t backing down anytime soon and the impact is becoming more noticeable in the architecture, engineering, and construction (A/E/C) space. The overall A/E/C outlook continues a downward trend and this is driven largely by the freefall happening in key private-sector markets.

Hotel Facilities | Jan 23, 2023
U.S. hotel construction pipeline up 14% to close out 2022
At the end of 2022’s fourth quarter, the U.S. construction pipeline was up 14% by projects and 12% by rooms year-over-year, according to Lodging Econometrics.

Products and Materials | Jan 18, 2023
Is inflation easing? Construction input prices drop 2.7% in December 2022
Softwood lumber and steel mill products saw the biggest decline among building construction materials, according to the latest U.S. Bureau of Labor Statistics’ Producer Price Index.

Market Data | Jan 10, 2023
Construction backlogs at highest level since Q2 2019, says ABC
Associated Builders and Contractors reports today that its Construction Backlog Indicator remained unchanged at 9.2 months in December 2022, according to an ABC member survey conducted Dec. 20, 2022, to Jan. 5, 2023. The reading is one month higher than in December 2021.

Market Data | Jan 6, 2023
Nonresidential construction spending rises in November 2022
Spending on nonresidential construction work in the U.S. was up 0.9% in November versus the previous month, and 11.8% versus the previous year, according to the U.S. Census Bureau.


