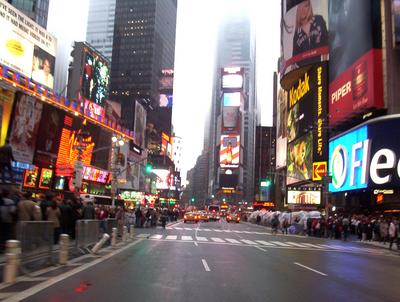
The Building Owners and Managers Association (BOMA) International has identified the most expensive commercial real estate markets in the U.S. The data is drawn from the 2011 Experience Exchange Report (EER), which provides an annual analysis of the office building operating income and expense data compiled across approximately 940 million square feet of commercial office space in more than 6,500 buildings in 278 different markets. The 2011 report is based on operating income and expenses from 2010.
The most expensive U.S. cities, based on total rental income, include:
- New York, N.Y., $48.27 per square foot (psf)
- Washington, D.C., $42.63 psf
- San Mateo, Calif., $41.61 psf
- Santa Monica, Calif., $36.67 psf
- San Francisco, Calif., $34.86 psf
- Boston, Mass., $31.15 psf
- San Jose, Calif., $30.35 psf
- Los Angeles, Calif., $27.97 psf
- West Palm Beach, Fla., $27.71 psf
- Chicago, Ill., $25.20 psf
Total rental income includes rental income from office, retail, and other space, which includes storage areas. Amid the economic downturn in real estate markets, few markets demonstrated significant increases in rental income, suggesting that rental rates remain relatively stable and favorable for tenants seeking to pursue new leases or renegotiate existing ones. Among the most expensive cities, only New York and San Francisco showed increases in rental income.
Gauging most expensive cities on the basis of total operating and fixed expenses produces a slightly different list:
- New York, N.Y., $21.44 psf
- Washington, D.C., $16.86 psf
- Boston, Mass., $15.16 psf
- Morristown, N.J., $14.67 psf
- San Francisco, Calif., $14.43 psf
- Miami, Fla., $12.87 psf
- Santa Monica, Calif., $12.84 psf
- Plainfield, N.J., $12.83 psf
- Chicago, Ill. and Los Angeles, Calif., 12.49 psf
- Newark, N.J., $12.46 psf
Total operating expenses includes all expenses incurred to operate office buildings, including utilities, repairs/maintenance, cleaning, administrative, security and roads and grounds. Fixed expenses include real estate taxes, property taxes and insurance. In New York, average total operating plus fixed expenses were $21.44 per square foot (psf), while in Los Angeles, they averaged $12.96 psf. Operating expenses increased in most markets in the last year. Fixed expenses were volatile, which could be attributed in part to rising utility costs as well as rising real estate taxes. While many cash-constrained cities and municipalities are looking to real estate for tax revenue, many property owners are contesting tax assessments because asset values have decreased due to the economic downturn. BD+C
Related Stories
| Aug 11, 2010
PBK, DLR Group among nation's largest K-12 school design firms, according to BD+C's Giants 300 report
A ranking of the Top 75 K-12 School Design Firms based on Building Design+Construction's 2009 Giants 300 survey. For more Giants 300 rankings, visit http://www.BDCnetwork.com/Giants
| Aug 11, 2010
Turner Building Cost Index dips nearly 4% in second quarter 2009
Turner Construction Company announced that the second quarter 2009 Turner Building Cost Index, which measures nonresidential building construction costs in the U.S., has decreased 3.35% from the first quarter 2009 and is 8.92% lower than its peak in the second quarter of 2008. The Turner Building Cost Index number for second quarter 2009 is 837.
| Aug 11, 2010
AGC unveils comprehensive plan to revive the construction industry
The Associated General Contractors of America unveiled a new plan today designed to revive the nation’s construction industry. The plan, “Build Now for the Future: A Blueprint for Economic Growth,” is designed to reverse predictions that construction activity will continue to shrink through 2010, crippling broader economic growth.
| Aug 11, 2010
New AIA report on embassies: integrate security and design excellence
The American Institute of Architects (AIA) released a new report to help the State Department design and build 21st Century embassies.
| Aug 11, 2010
Section Eight Design wins 2009 Open Architecture Challenge for classroom design
Victor, Idaho-based Section Eight Design beat out seven other finalists to win the 2009 Open Architecture Challenge: Classroom, spearheaded by the Open Architecture Network. Section Eight partnered with Teton Valley Community School (TVCS) in Victor to design the classroom of the future. Currently based out of a remodeled house, students at Teton Valley Community School are now one step closer to getting a real classroom.


