


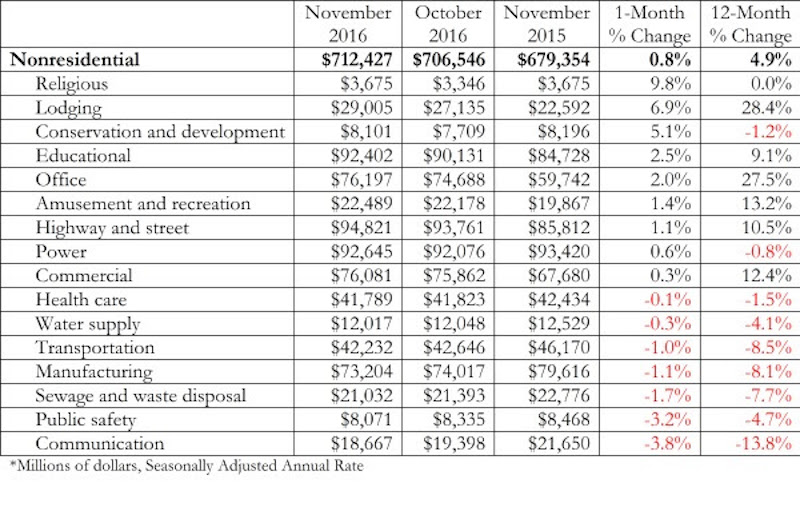
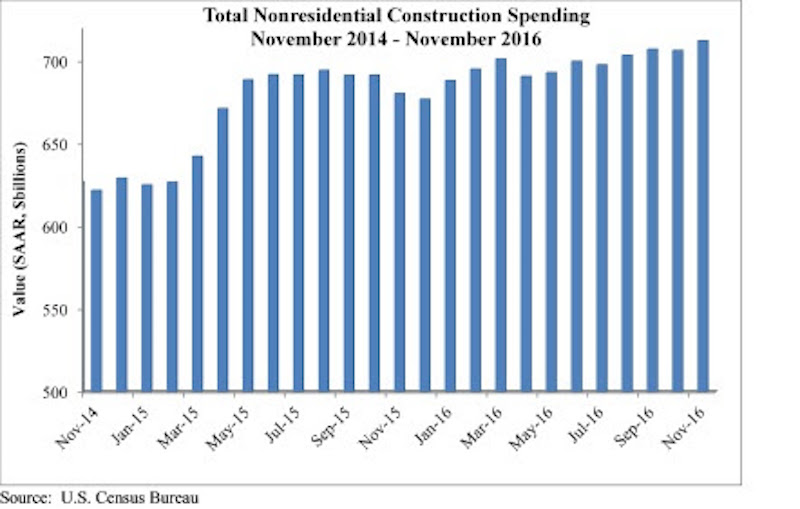
Nonresidential construction surged in November, according to analysis of U.S. Census Bureau data released by Associated Builders and Contractors (ABC). Nonresidential spending expanded to $712.4 billion on a seasonally adjusted, annualized rate in November, representing the highest level of spending in eight years.
October’s figure was upwardly revised by 1 percent (from $699.7 billion to $706.5 billion), while September’s figure was upwardly revised by 0.8 percent (from $701.7 billion to $707.2 billion). A bit more than half of the 16 subsectors experienced spending increases in November.
“Nonresidential construction spending is up approximately 5 percent on a year-over-year basis, and momentum should build further,” says ABC Chief Economist Anirban Basu in a press release. ““If the last few weeks are any indication, the 2017 economy will be associated with tax cuts, more government spending, less financial regulation, faster economic growth, a stronger U.S. dollar, robust stock market performance and greater overall CEO confidence. That should translate into improved construction spending moving forward.”
A stronger U.S. dollar, larger budget deficits, and rising interest rates could shrink U.S. exports and serve to suppress U.S. economic dynamism, but the current nonresidential construction outlook is promising, according to Basu.
Related Stories
Market Data | Aug 17, 2017
Marcum Commercial Construction Index reports second quarter spending increase in commercial and office construction
Spending in all 12 of the remaining nonresidential construction subsectors retreated on both an annualized and monthly basis.

Industry Research | Aug 11, 2017
NCARB releases latest data on architectural education, licensure, and diversity
On average, becoming an architect takes 12.5 years—from the time a student enrolls in school to the moment they receive a license.

Market Data | Aug 4, 2017
U.S. grand total construction starts growth projection revised slightly downward
ConstructConnect’s quarterly report shows courthouses and sports stadiums to end 2017 with a flourish.

Market Data | Aug 2, 2017
Nonresidential Construction Spending falls in June, driven by public sector
June’s weak construction spending report can be largely attributed to the public sector.

Market Data | Jul 31, 2017
U.S. economic growth accelerates in second quarter; Nonresidential fixed investment maintains momentum
Nonresidential fixed investment, a category of GDP embodying nonresidential construction activity, expanded at a 5.2% seasonally adjusted annual rate.

Multifamily Housing | Jul 27, 2017
Apartment market index: Business conditions soften, but still solid
Despite some softness at the high end of the apartment market, demand for apartments will continue to be substantial for years to come, according to the National Multifamily Housing Council.

Market Data | Jul 25, 2017
What's your employer value proposition?
Hiring and retaining talent is one of the top challenges faced by most professional services firms.

Market Data | Jul 25, 2017
Moderating economic growth triggers construction forecast downgrade for 2017 and 2018
Prospects for the construction industry have weakened with developments over the first half of the year.

Industry Research | Jul 6, 2017
The four types of strategic real estate amenities
From swimming pools to pirate ships, amenities (even crazy ones) aren’t just perks, but assets to enhance performance.
Market Data | Jun 29, 2017
Silicon Valley, Long Island among the priciest places for office fitouts
Coming out on top as the most expensive market to build out an office is Silicon Valley, Calif., with an out-of-pocket cost of $199.22.


