


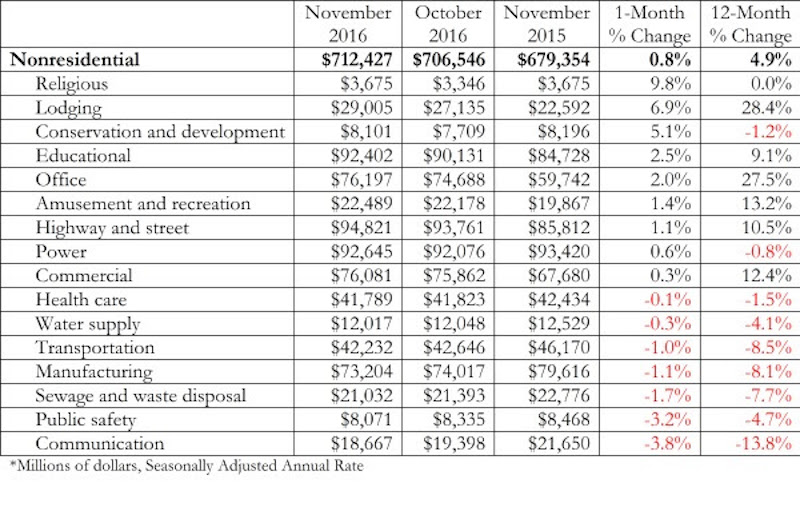
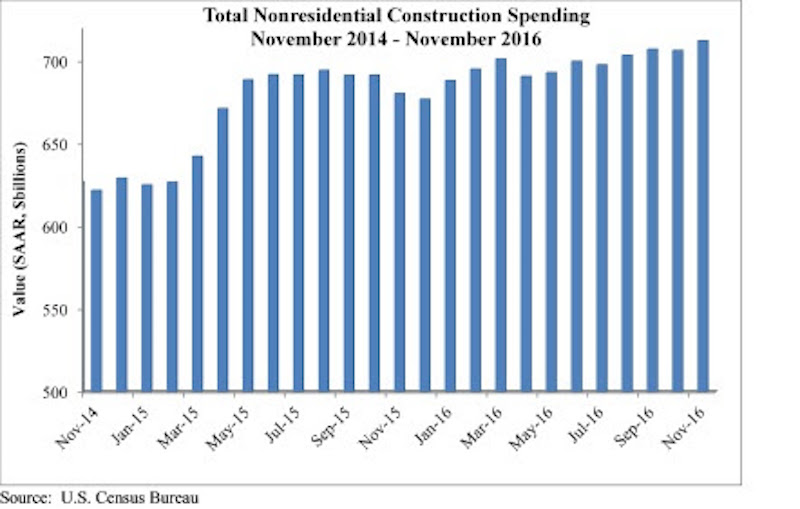
Nonresidential construction surged in November, according to analysis of U.S. Census Bureau data released by Associated Builders and Contractors (ABC). Nonresidential spending expanded to $712.4 billion on a seasonally adjusted, annualized rate in November, representing the highest level of spending in eight years.
October’s figure was upwardly revised by 1 percent (from $699.7 billion to $706.5 billion), while September’s figure was upwardly revised by 0.8 percent (from $701.7 billion to $707.2 billion). A bit more than half of the 16 subsectors experienced spending increases in November.
“Nonresidential construction spending is up approximately 5 percent on a year-over-year basis, and momentum should build further,” says ABC Chief Economist Anirban Basu in a press release. ““If the last few weeks are any indication, the 2017 economy will be associated with tax cuts, more government spending, less financial regulation, faster economic growth, a stronger U.S. dollar, robust stock market performance and greater overall CEO confidence. That should translate into improved construction spending moving forward.”
A stronger U.S. dollar, larger budget deficits, and rising interest rates could shrink U.S. exports and serve to suppress U.S. economic dynamism, but the current nonresidential construction outlook is promising, according to Basu.
Related Stories
Market Data | May 24, 2021
Construction employment in April remains below pre-pandemic peak in 36 states and D.C.
Texas and Louisiana have worst job losses since February 2020, while Utah and Idaho are the top gainers.

Market Data | May 19, 2021
Design activity strongly increases
Demand signals construction is recovering.

Multifamily Housing | May 18, 2021
Multifamily housing sector sees near record proposal activity in early 2021
The multifamily sector led all housing submarkets, and was third among all 58 submarkets tracked by PSMJ in the first quarter of 2021.
Market Data | May 18, 2021
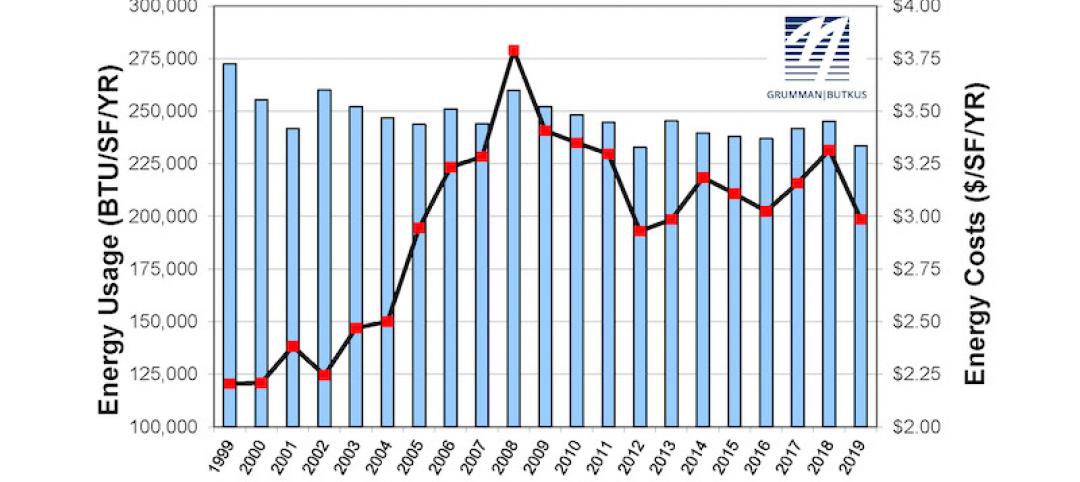
Grumman|Butkus Associates publishes 2020 edition of Hospital Benchmarking Survey
The report examines electricity, fossil fuel, water/sewer, and carbon footprint.
Market Data | May 13, 2021
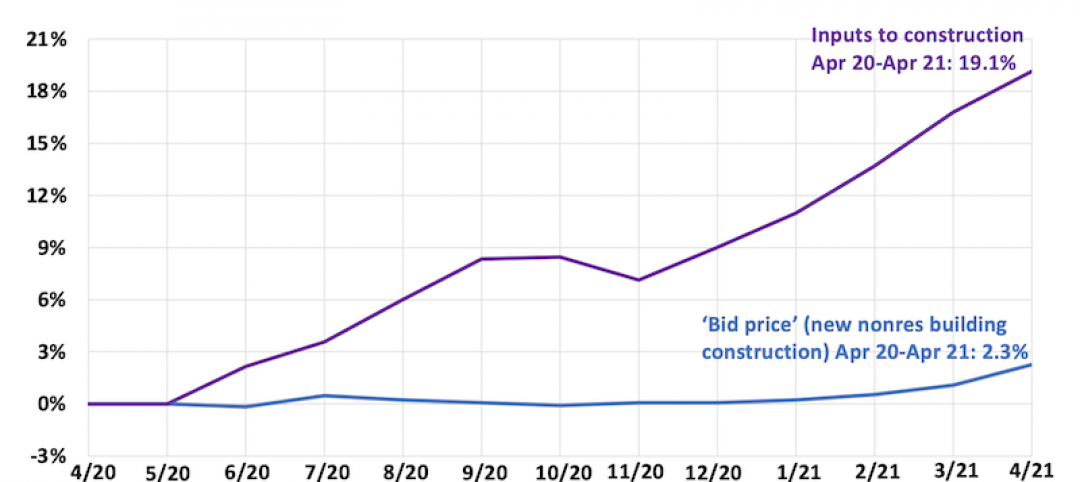
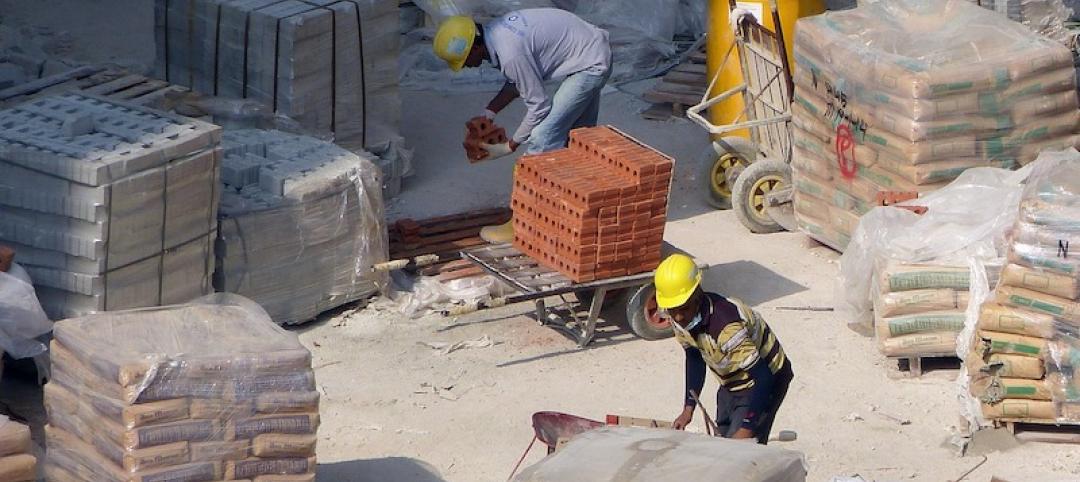
Proliferating materials price increases and supply chain disruptions squeeze contractors and threaten to undermine economic recovery
Producer price index data for April shows wide variety of materials with double-digit price increases.
Market Data | May 7, 2021
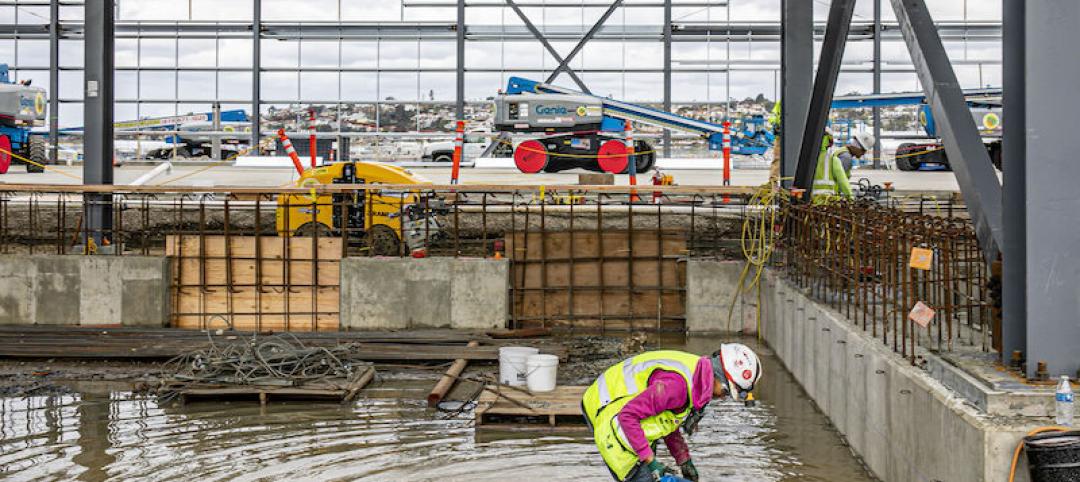
Construction employment stalls in April
Soaring costs, supply-chain challenges, and workforce shortages undermine industry's recovery.
Market Data | May 4, 2021
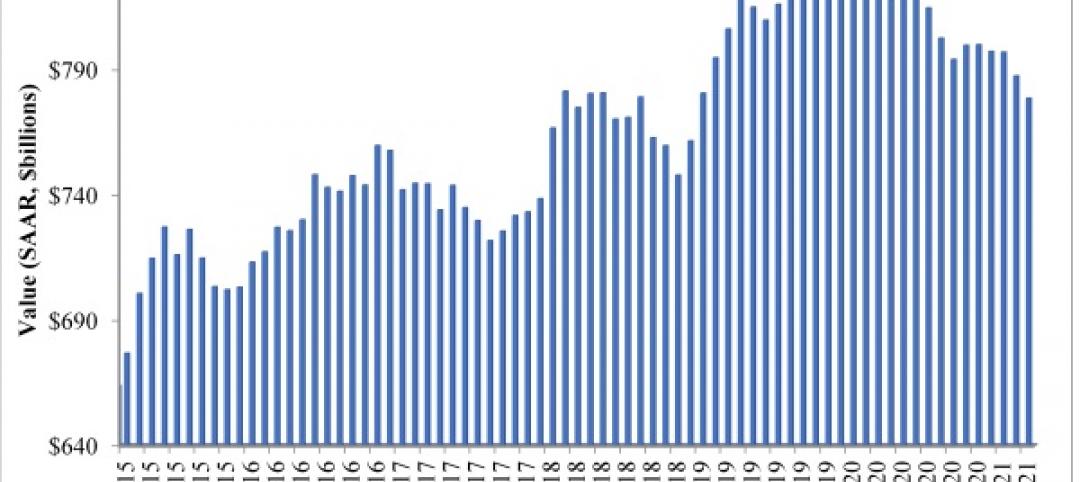
Nonresidential construction outlays drop in March for fourth-straight month
Weak demand, supply-chain woes make further declines likely.
Market Data | May 3, 2021
Nonresidential construction spending decreases 1.1% in March
Spending was down on a monthly basis in 11 of the 16 nonresidential subcategories.

Market Data | Apr 30, 2021
New York City market continues to lead the U.S. Construction Pipeline
New York City has the greatest number of projects under construction with 110 projects/19,457 rooms.

Market Data | Apr 29, 2021
U.S. Hotel Construction pipeline beings 2021 with 4,967 projects/622,218 rooms at Q1 close
Although hotel development may still be tepid in Q1, continued government support and the extension of programs has aided many businesses to get back on their feet as more and more are working to re-staff and re-open.


