


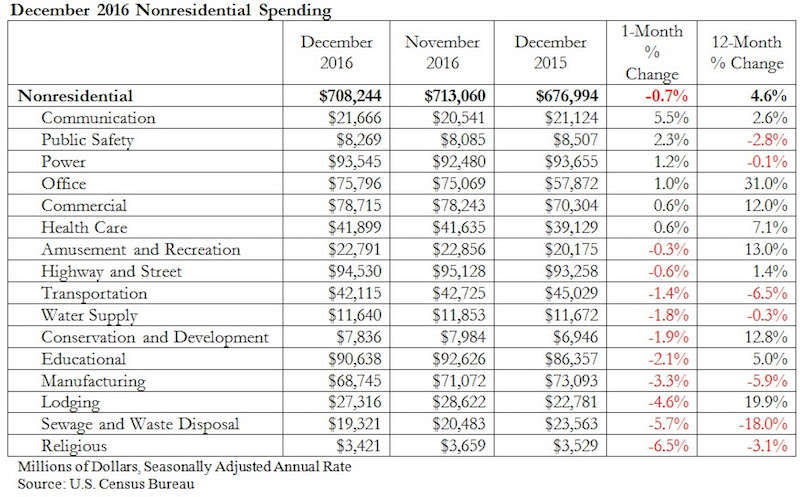
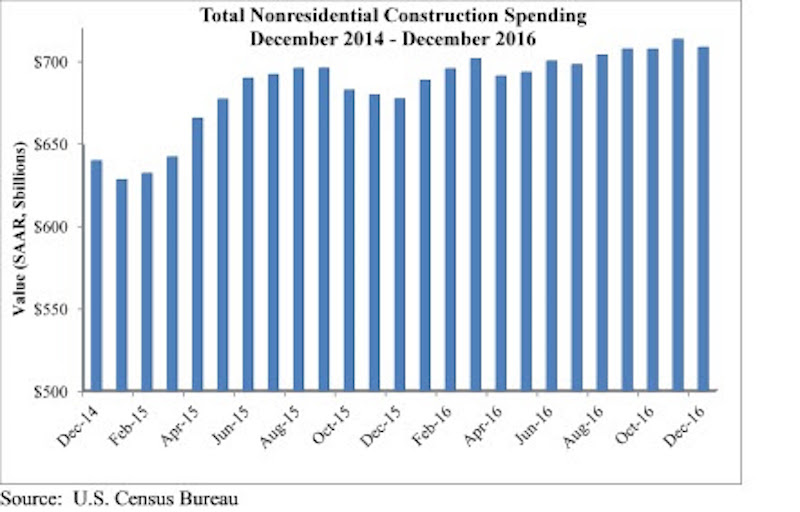
Nonresidential construction spending slipped 0.7 percent in the final month of 2016, but increased 4.6 percent over the previous year, according to analysis of U.S. Census Bureau data recently released by Associated Builders and Contractors (ABC). Nonresidential spending decreased from $713.1 billion in November to $708.2 billion in December on a seasonally adjusted, annualized basis.
Both November’s estimate ($713.1 billion) and October’s estimate ($707.1 billion) were upwardly revised by less than one-tenth of a percent. Private nonresidential spending remained flat for the month, while public nonresidential spending contracted 1.7 percent.
“Private spending growth, which has led nonresidential spending growth for months, remained flat in December and, as a result, the preexisting story of the industry remains fundamentally unchanged,” said ABC Chief Economist Anirban Basu in a release. “Public construction spending has been soft for many years and the December spending data merely served to extend that part of the tale. Spending in the sewage and waste disposal, transportation, and public safety sectors was particularly weak during the past 12 months. Private spending growth has been on-again, off-again for much of the year, so it is not a surprise that last month’s robust spending report was followed by a flat one.
“On the bright side, the architectural community became much busier in December, signaling an acceleration of commercial activity to come,” said Basu. “In addition, the new administration appears committed to fulfilling its campaign promises, including a pledge to step up infrastructure spending. This has asphalt, pavement and other infrastructure-intensive contractors expressing more confidence in their economic future than they have for many years. As such, the December data provide little insight into the future trajectory of nonresidential construction spending, which is set to improve markedly during the next six to 12 months.”
Related Stories

Construction Costs | May 16, 2024
New download: BD+C's May 2024 Market Intelligence Report
Building Design+Construction's monthly Market Intelligence Report offers a snapshot of the health of the U.S. building construction industry, including the commercial, multifamily, institutional, and industrial building sectors. This report tracks the latest metrics related to construction spending, demand for design services, contractor backlogs, and material price trends.

Contractors | May 15, 2024
The average U.S. contractor has 8.4 months worth of construction work in the pipeline, as of April 2024
Associated Builders and Contractors reported that its Construction Backlog Indicator increased to 8.4 months in April, according to an ABC member survey conducted April 22 to May 6. The reading is down 0.5 months from April 2023, but expanded 0.2 months from the prior month.

Healthcare Facilities | May 6, 2024
Hospital construction costs for 2024
Data from Gordian breaks down the average cost per square foot for a three-story hospital across 10 U.S. cities.

Contractors | May 1, 2024
Nonresidential construction spending rises 0.2% in March 2024 to $1.19 trillion
National nonresidential construction spending increased 0.2% in March, according to an Associated Builders and Contractors analysis of data published today by the U.S. Census Bureau. On a seasonally adjusted annualized basis, nonresidential spending totaled $1.19 trillion.

AEC Tech | Apr 30, 2024
Lack of organizational readiness is biggest hurdle to artificial intelligence adoption
Managers of companies in the industrial sector, including construction, have bought the hype of artificial intelligence (AI) as a transformative technology, but their organizations are not ready to realize its promise, according to research from IFS, a global cloud enterprise software company. An IFS survey of 1,700 senior decision-makers found that 84% of executives anticipate massive organizational benefits from AI.

Hotel Facilities | Apr 24, 2024
The U.S. hotel construction market sees record highs in the first quarter of 2024
As seen in the Q1 2024 U.S. Hotel Construction Pipeline Trend Report from Lodging Econometrics (LE), at the end of the first quarter, there are 6,065 projects with 702,990 rooms in the pipeline. This new all-time high represents a 9% year-over-year (YOY) increase in projects and a 7% YOY increase in rooms compared to last year.

Construction Costs | Apr 18, 2024
New download: BD+C's April 2024 Market Intelligence Report
Building Design+Construction's monthly Market Intelligence Report offers a snapshot of the health of the U.S. building construction industry, including the commercial, multifamily, institutional, and industrial building sectors. This report tracks the latest metrics related to construction spending, demand for design services, contractor backlogs, and material price trends.

Market Data | Apr 16, 2024
The average U.S. contractor has 8.2 months worth of construction work in the pipeline, as of March 2024
Associated Builders and Contractors reported today that its Construction Backlog Indicator increased to 8.2 months in March from 8.1 months in February, according to an ABC member survey conducted March 20 to April 3. The reading is down 0.5 months from March 2023.

K-12 Schools | Apr 10, 2024
Surprise, surprise: Students excel in modernized K-12 school buildings
Too many of the nation’s school districts are having to make it work with less-than-ideal educational facilities. But at what cost to student performance and staff satisfaction?

Multifamily Housing | Apr 9, 2024
March reports record gains in multifamily rent growth in 20 months
Asking rents for multifamily units increased $8 during the month to $1,721; year-over-year growth grew 30 basis points to 0.9 percent—a normal seasonal growth pattern according to Yardi Matrix.


