

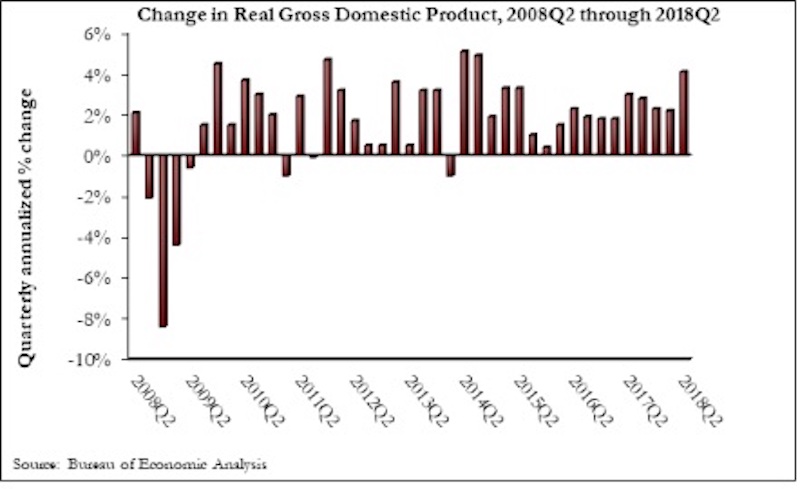
The U.S. economy expanded at an annualized 4.1% rate during the second quarter of 2018—the fastest rate of quarterly growth since the second quarter of 2014, according to an Associated Builders and Contractors analysis of U.S. Bureau of Economic Analysis data released today.
Nonresidential fixed investment represented an especially important element of second quarter strength in the advance estimate. While overall fixed investment expanded at a 5.4% annualized pace, nonresidential fixed investment grew 7.3%. The nonresidential sub-component exhibiting the most upward force was structures, which grew at a 13.3% annualized pace and by 13.9% during the year’s initial quarter.
Today’s data release helps explain why nonresidential contractors continue to report hefty backlog and scramble for human capital. By contrast, the residential segment, which continues to be impacted by rising mortgage rates and the lowest level of housing affordability in a decade, contracted at a 1.1% annualized rate and has now shrunk during three of the previous four quarters.
“It is quite remarkable that an economy now in its 10th year of economic expansion is actually gaining steam,” said ABC Chief Economist Anirban Basu. “A host of forces are at work, including elevated levels of confidence among business owners, developers and others who drive investment in America. Meanwhile, the consumer, supported by the strongest labor market in about two decades, continues to reliably contribute to economic growth. The result is an economy that is now on its way to a potential 3% growth year.
“As always, there are reasons to temper optimism,” said Basu. “Some of second quarter growth was driven by aggressive purchases of American output (e.g. soybeans) in advance of the imposition of retaliatory tariffs. That helped bulk up exports, but that pattern may not continue during the third quarter. The rapidly expanding economy is also serving to exacerbate inflationary pressures, which in turn are likely to drive borrowing costs higher. In other words, today’s strong economic growth may translate into weaker economic growth at some point in the future, and there is plenty of precedent for such a dynamic.
“Contractors can rest assured that the economy will retain its momentum through the balance of the year,” said Basu. “While financial markets may remain volatile and the global news cycle will undoubtedly continue to swirl, leading indicators, including those related to the level of observable activity among engineers, architects and other design professionals, suggest that another wave of building construction is on the way. The tax cuts passed late last year are just now beginning to have an impact. The hope is that tax reform will trigger a structural shift in the U.S. economy by helping to expand productivity and the economy’s long-term growth potential.The other possibility is that the tax reform’s primary effects will be to lift short-term growth, expand federal budget deficits, and ultimately give way to a countervailing reform at some point in the future.”
Related Stories

Industry Research | Aug 11, 2017
NCARB releases latest data on architectural education, licensure, and diversity
On average, becoming an architect takes 12.5 years—from the time a student enrolls in school to the moment they receive a license.

Market Data | Aug 4, 2017
U.S. grand total construction starts growth projection revised slightly downward
ConstructConnect’s quarterly report shows courthouses and sports stadiums to end 2017 with a flourish.

Market Data | Aug 2, 2017
Nonresidential Construction Spending falls in June, driven by public sector
June’s weak construction spending report can be largely attributed to the public sector.

Market Data | Jul 31, 2017
U.S. economic growth accelerates in second quarter; Nonresidential fixed investment maintains momentum
Nonresidential fixed investment, a category of GDP embodying nonresidential construction activity, expanded at a 5.2% seasonally adjusted annual rate.

Multifamily Housing | Jul 27, 2017
Apartment market index: Business conditions soften, but still solid
Despite some softness at the high end of the apartment market, demand for apartments will continue to be substantial for years to come, according to the National Multifamily Housing Council.

Market Data | Jul 25, 2017
What's your employer value proposition?
Hiring and retaining talent is one of the top challenges faced by most professional services firms.

Market Data | Jul 25, 2017
Moderating economic growth triggers construction forecast downgrade for 2017 and 2018
Prospects for the construction industry have weakened with developments over the first half of the year.

Industry Research | Jul 6, 2017
The four types of strategic real estate amenities
From swimming pools to pirate ships, amenities (even crazy ones) aren’t just perks, but assets to enhance performance.
Market Data | Jun 29, 2017
Silicon Valley, Long Island among the priciest places for office fitouts
Coming out on top as the most expensive market to build out an office is Silicon Valley, Calif., with an out-of-pocket cost of $199.22.

Market Data | Jun 26, 2017
Construction disputes were slightly less contentious last year
But poorly written and administered contracts are still problems, says latest Arcadis report.


